This tutorial has been written for an old version of JBoss AS 5. At the bottom of it, you will find how to monitor JBoss 5 from the JMX-Console.
If you are running WildFly or JBoss EAP 7, we recommend the following updated resources:
- Monitoring Enterprise applications with OpenShift and Prometheus
- Monitoring WildFly with Prometheus
- Using Prometheus and Grafana to capture Alerts and visualize Metrics
- Using ELK stack to collect WildFly / JBoss EAP metrics
Monitoring JBoss AS 5
You’ve been using the JMX Console to access your MBeans. In this example we’ll look at MBeans through the Web Console, which adds a few new twists to what you’ve seen so far.
The Web Console is found in the home page just under the JMX-Console. Enter it !
Now Expand the System icon and then the JMX MBeans tree.
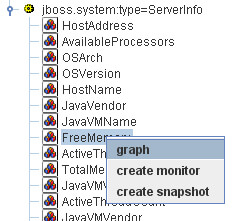
jboss.system domain: expand it and look for the MBean jboss.system:type=ServerInfo.
Beneath this Mbean you can find all the monitoring options available: you should be able to right click on in and get a few menu options:
Let’s find the
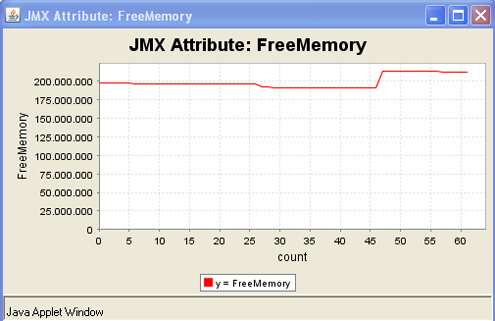
Now Supposing you want to draw a graph of the attribute FreeMemory, simply right click on FreeMemory and you’ll see a real-time graph of your Free Memory.
Cool isn’t it ?