This is the third tutorial about how to use Prometheus server to capture metrics from a Microprofile compatible server like WildFly or Quarkus. In the first two tutorials, we have discussed how to set up Prometheus to connect to WildFly (Monitoring WildFly with Prometheus) and Quarkus ( Monitoring Quarkus with Prometheus) to capture Microprofile metrics. We will now learn how to use the Alert Manager to capture, group or export our alerts. Then, we will learn how to export our metrics in a Grafana dashboard.
Step 1: Set up the environment
We will be working with the following components:
- Prometheus: collects metrics from various sources and stores them in a time-series database. It uses PromQL for data analysis and alerting.
- Alertmanager: receives alerts from Prometheus and handles them appropriately, such as sending notifications. It can group, prioritize, and de-duplicate alerts.
- Grafana: creates dashboards of metrics from Prometheus using drag-and-drop and various chart types. It also supports alerting and data integration.
To speed up the environment set up, we will use Docker compose to bootstrap all them with just a main configuration file.
Firstly, create the following docker-compose.yml file:
version: '3'

services:
  prometheus:
    image: prom/prometheus:v2.42.0
    user: 0:0
    ports:
      - 9090:9090
    volumes:
      - ./prometheus:/etc/prometheus
      - prometheus-data:/prometheus
    extra_hosts:
      host.docker.internal: host-gateway
    command: --web.enable-lifecycle  --config.file=/etc/prometheus/prometheus.yml


  grafana:
    image: grafana/grafana:8.2.2
    user: 0:0
    ports:
      - 3000:3000
    restart: unless-stopped
    volumes:
      - ./grafana/provisioning/datasources:/etc/grafana/provisioning/datasources
      - grafana-data:/var/lib/grafana

  alertmanager:
    image: prom/alertmanager:v0.23.0
    user: 0:0
    restart: unless-stopped
    ports:
      - "9093:9093"
    volumes:
      - "./alertmanager:/config"
      - alertmanager-data:/data
    command: --config.file=/config/alertmanager.yml --log.level=debug

volumes:
  prometheus-data:
  grafana-data:
  alertmanager-data:
As you can see, the above file starts the docker image of the three components. Since we will scrape metrics from a WildFly server running outside of Docker, we needed to add the host.docker.internal to Prometheus external hosts.
Next, let’s add the configuration for each component.
Adding Prometheus configuration
The following prometheus.yml file will scrape metrics from WildFly on port 9990:
global:
  scrape_interval:     10s # Set the scrape interval to every 15 seconds. Default is every 1 minute.
  evaluation_interval: 10s # Evaluate rules every 15 seconds. The default is every 1 minute.
  # scrape_timeout is set to the global default (10s).
# Alertmanager configuration
alerting:
  alertmanagers:
    - scheme: http
      static_configs:
        - targets: [ 'alertmanager:9093' ]
# Load rules once and periodically evaluate them according to the global 'evaluation_interval'.
rule_files:
  - rules.yml

scrape_configs:
  # this is the configuration to poll metrics from WildFly 15
  - job_name: 'metrics'
    scrape_interval: 10s
    static_configs:
      - targets: ['host.docker.internal:9990']
Place the above file in the prometheus folder.
Additionally, in the prometheus folder add also the rules.yml file which defines an alert for WildFly service down:
groups:
- name: example
  rules:

  - alert: service_down
    expr: up{job="metrics"} == 0
    labels:
      severity: major
    annotations:
      description: Service {{ $labels.instance }} is unavailable.
      value: DOWN ({{ $value }})
Adding the Alert Manager configuration
Next, within the alertmanager folder, add the following alertmanager.yml file configuration:
route:
  group_by: [ alertname ]
  receiver: 'mail' # default receiver
  repeat_interval: 24h
  routes:
    - receiver: 'teams'
      repeat_interval: 12h
      matchers:
        - severity="medium"

    - receiver: 'teams'
      repeat_interval: 4h
      matchers:
        - severity="high"


receivers:
  - name: 'mail'
    email_configs:
      - smarthost: 'yourmailhost.com:465'
        auth_username: '[email protected]'
        auth_password: "your mail password"
        from: '[email protected]'
        to: '[email protected]'
        require_tls: false
This configuration file defines how Alertmanager will handle alerts based on their severity and grouping. The default receiver is “mail”, which sends alerts to an email address. If an alert has a medium severity, it will also be sent to teams using the “teams” receiver. If an alert has a high severity, it will be sent to teams more frequently using the “teams” receiver.
Adding Grafana configuration
Finally, we will add the Grafana configuration in the folder grafana/provisioning/datasource:
datasources:
- name: Prometheus
  access: proxy
  type: prometheus
  url: http://prometheus:9090
  isDefault: true
This configuration defines a data source named “Prometheus” for Grafana to connect to the Prometheus server running at “http://prometheus:9090”. The data source is configured as a proxy, which means that Grafana will connect to the Prometheus server directly and proxy the queries to it. This is the most common way to connect Grafana to Prometheus. The data source is also set as the default, which means that it will be used for all queries unless a specific data source is specified.
Step 2: Start the Docker Containers
Firstly, here is an overview of our Docker Compose project:
├── alertmanager
│   └── alertmanager.yml
├── docker-compose.yml
├── grafana
│   └── provisioning
│       └── datasources
│           └── prometheus_ds.yml
├── prometheus
│   ├── alert.yml
│   ├── prometheus.yml
│   └── rules.yml
Next, start the docker-compose file as follows:
docker-compose up
Verify that Prometheus and Grafana are up and running:
prometheus_1    | ts=2023-12-09T18:58:07.598Z caller=main.go:978 level=info msg="Server is ready to receive web requests."
prometheus_1    | ts=2023-12-09T18:58:07.598Z caller=manager.go:974 level=info component="rule manager" msg="Starting rule manager..."
grafana_1       | t=2023-12-09T18:58:07+0000 lvl=info msg="Starting DB migrations" logger=migrator
grafana_1       | t=2023-12-09T18:58:07+0000 lvl=info msg="migrations completed" logger=migrator performed=0 skipped=346 duration=504.378µs
grafana_1       | t=2023-12-09T18:58:07+0000 lvl=info msg="Starting plugin search" logger=plugins
grafana_1       | t=2023-12-09T18:58:07+0000 lvl=info msg="Registering plugin" logger=plugins id=input
grafana_1       | t=2023-12-09T18:58:07+0000 lvl=info msg="Live Push Gateway initialization" logger=live.push_http
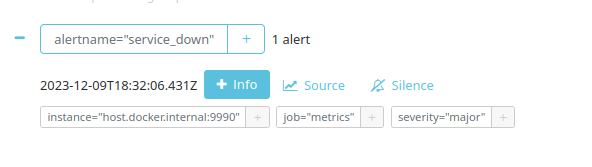
Then, as first step, head to the Alert manager console: http://localhost:9093/#/alerts
Since WildFly is still not running, you should be able to see the following Alert:
Step 3: Start WildFly and check connectivity
We are now ready to start WildFly. Let’s start all available interfaces of the application server as follows:
./standalone.sh -b 0.0.0.0 -bmanagement=0.0.0.0
Firstly, if you move to the Alert Manager console at http://localhost:9093/#/alerts you should no longer see the Alert for the “metrics” Prometheus job.
Then, let’s move to Prometheus Console at http://localhost:9090/targets and check that you are able to scrape metrics from WildFly:

Step 4: Visualize your application Metrics with Grafana
The last step will be visualizing the Metrics collected by Prometheus with Grafana.
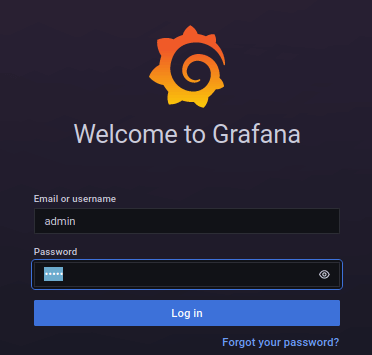
Log into Grafana console available at localhost:3000. Login with the default user (admin/admin).
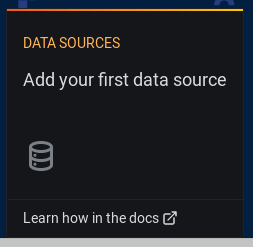
As soon as you are logged in, add a DataSource to it:
Choose to add a Prometheus Datasource:

Next, use the default Prometheus host/port (localhost:9090) for your Datasource:

Next, we will add a new Dashboard.
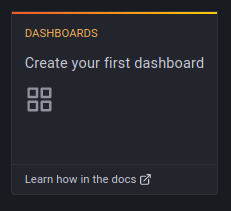
A Dashboard is a set of one or more panels organized and arranged into one or more rows. Within your Dashboard, bind it to your Prometheus Datasource and choose a Query expression. The Query expression can be any metric which has been published by your Enterprise service. For example, choose the “base_memory_usedHeap_bytes” which shows the amount of Heap you are using (in bytes):
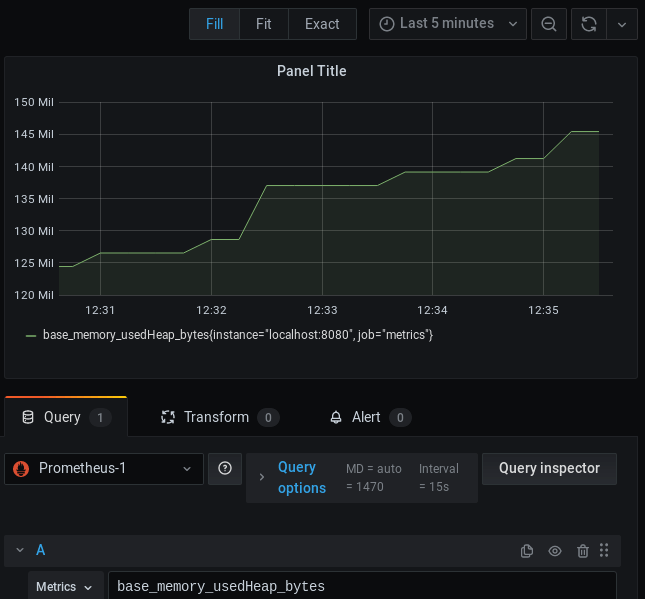
As you can see from the above picture, the amount of Memory of your Enterprise application will be visualized in a nice Grafana Dashboard, which will be updating based on the chosen timing factor.
Conclusion
We have discussed how to use the Alert Manager to group/forward the Alerts for our Enterprise Application collected by Prometheus. We have then learnt how to export our Metrics in the Grafana opensource tool using a Datasource and check them in a Dashboard
You can find the Docker Compose project here: https://github.com/fmarchioni/mastertheboss/tree/master/monitoring/prometheus-grafana