Prometheus is an open-source monitoring system that collects metrics from servers, services, and applications. It is known for its lightweight design, scalability, and ease of use. WildFly is a popular Java EE application server that can be monitored using Prometheus.
Prometheus Main Features
Prometheus has several key features that make it a powerful monitoring tool:
- Multi-dimensional data model: Prometheus stores metrics in a multi-dimensional data model, which allows for flexible querying and aggregation of data.
- Flexible query language: Prometheus uses PromQL, a powerful query language, to extract insights from the collected metrics.
- Push-based architecture: Prometheus is a pull-based system, which means that it does not require agents to be installed on the monitored systems. Instead, the Prometheus server periodically scrapes the metrics from the target systems.
- Scalable: Prometheus is highly scalable and can be used to monitor large-scale deployments.
Setting up Prometheus
Firstly, we will set up the Prometheus environment. If you are installing on a local machine, you can download the latest release of Prometheus from https://prometheus.io/download/
Then, unzip the release:
├── console_libraries
│   ├── menu.lib
│   └── prom.lib
├── consoles
│   ├── index.html.example
│   ├── node-cpu.html
│   ├── node-disk.html
│   ├── node.html
│   ├── node-overview.html
│   ├── prometheus.html
│   └── prometheus-overview.html
├── LICENSE
├── NOTICE
├── prometheus
├── prometheus.yml
└── promtool
Within the installation folder, we will operate on the prometheus.yml file which is Prometheus main configuration file. The main change we need to apply is adding a scrape configuration to fetch metrics from WildFly on the default server address and port 9990:
global:
  scrape_interval:     10s # Set the scrape interval to every 15 seconds. Default is every 1 minute.
  evaluation_interval: 10s # Evaluate rules every 15 seconds. The default is every 1 minute.
  # scrape_timeout is set to the global default (10s).

# A scrape configuration containing exactly one endpoint to scrape:
# Here it's Prometheus itself.
scrape_configs:
  # this is the configuration to poll metrics from WildFly 15
  - job_name: 'wildfly metrics'
    scrape_interval: 10s
    static_configs:
      - targets: ['localhost:9990']
You can now start the prometheus command line:
$ prometheus
Then, in another shell, start WildFly application Server:
$ standalone.sh
You can skip the next section if you don’t plan to run Prometheus with Docker.
How to run Prometheus with Docker
In order to run Prometheus with Docker and fetch metrics from a local WildFly installation we need to apply some network tweaks to the configuration.
As a matter of fact, Prometheus running in Docker won’t be able to access the localhost address of WildFly as it is. For that, you need to use the “host.docker.internal“. The term “host.docker.internal” is a special DNS name resolver that resolves to the internal IP address of the Docker host. This means that you can use “host.docker.internal” to access services running on your Docker host from within a Docker container. This is useful for accessing services that are not exposed to the outside world, such as WildFly or a Database.
Without further ado, let’s fix the prometheus.yml file as follows:
scrape_configs:
  # this is the configuration to poll metrics from WildFly 15
  - job_name: 'metrics'
    scrape_interval: 10s
    static_configs:
      - targets: ['host.docker.internal:9990']
Then, start the Prometheus Docker Image prom/prometheus passing in the mount options the configuration file. Also, we need to add the host.docker.internal to the list of known hosts:
docker run --rm --name my-prometheus --mount type=bind,source=/path/prometheus.yml,destination=/etc/prometheus/prometheus.yml -p 9090:9090 --add-host host.docker.internal:host-gateway prom/prometheus:v2.42.0
Alternatively, if you want to start Prometheus with Docker Compose, place the prometheus.yml file in the prometheus folder and use the following docker-compose.yml:
version: '3'

services:
  prometheus:
    image: prom/prometheus:v2.42.0
    user: 0:0
    ports:
      - 9090:9090
    volumes:
      - ./prometheus:/etc/prometheus
      - prometheus-data:/prometheus
    extra_hosts:
      host.docker.internal: host-gateway
    command: --web.enable-lifecycle  --config.file=/etc/prometheus/prometheus.yml
Finally, we need to start WildFly. Since the communication will not go through the loopback address, we need to expose all available network interfaces:
./standalone.sh -b 0.0.0.0 -bmanagement=0.0.0.0
That’s all. From now on, we will explore the Prometheus Web console to check WildFly metrics.
Collecting WildFly metrics from Prometheus
WildFly metrics are available by default at this endpoint: http://localhost:9990/metrics . Firstly check that you are able to fetch them:
curl --silent http://localhost:9990/metrics | head
# HELP base:classloader_total_loaded_class_count Displays the total number of classes that have been loaded since the Java virtual machine has started execution.
# TYPE base:classloader_total_loaded_class_count counter
base:classloader_total_loaded_class_count 23056.0
# HELP base:cpu_system_load_average Displays the system load average for the last minute. The system load average is the sum of the number of runnable entities queued to the available processors and the number of runnable entities running on the available processors averaged over a period of time. The way in which the load average is calculated is operating system specific but is typically a damped time-dependent average. If the load average is not available, a negative value is displayed. This attribute is designed to provide a hint about the system load and may be queried frequently. The load average may be unavailable on some platform where it is expensive to implement this method.
# TYPE base:cpu_system_load_average gauge
base:cpu_system_load_average 1.15
# HELP base:thread_count Number of currently deployed threads
# TYPE base:thread_count counter
base:thread_count 69.0
# HELP base:classloader_current_loaded_class_count Displays the number of classes that are currently loaded in the Java virtual machine.
Ok, that’s just the first part of WildFly metrics. Let’s jump into Prometheus console which is available at: http://localhost:9090
Verify that Prometheus is able to connect to the target host at: http://localhost:9090/targets

Great! WildFly is connected to Prometheus. Now let’s try capture a WildFly metric in a Graph.
Head to http://localhost:9090/graph and enter a metric such as a WildFly metric like “base_cpu_system_load_average” into the search console and click on Execute:
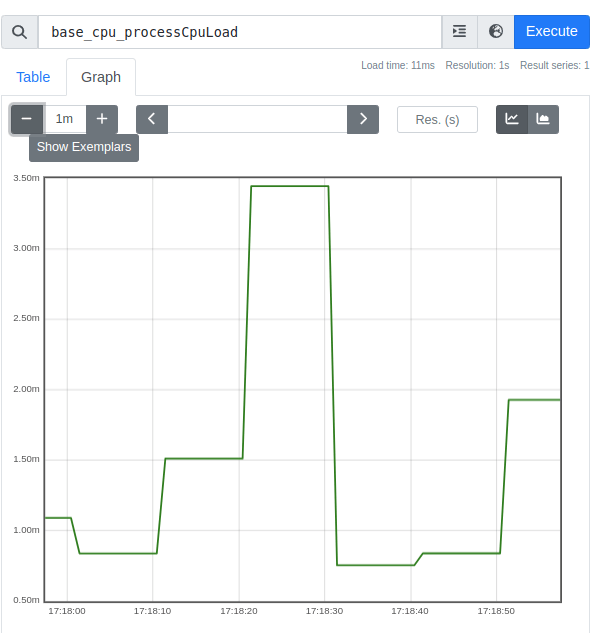
As you can see. Prometheus is collecting metrics about CpuLoad.
Collecting WildFly runtime metrics
Out of the box, WIldFly exposes a set of core metrics, like the above one. If you want to capture runtime metrics of a subsystem you need to enable them. For example, to collect metrics of the undertow (web server) subsystem, run the following CLI command from the jboss-cli.sh tool:
/subsystem=undertow:write-attribute(name=statistics-enabled,value=true)
Conclusion
In this tutorial we have learned how to get started with Prometheus, installing the binary server and capturing WildFly metrics. Keep learning about monitoring WildFly in this tutorial: Using Prometheus and Grafana to capture Alerts and visualize Metrics
If you want to learn how to monitor Spring Boot application with Prometheus, we recommend the following article: Monitoring Spring Boot with Prometheus and Micrometer