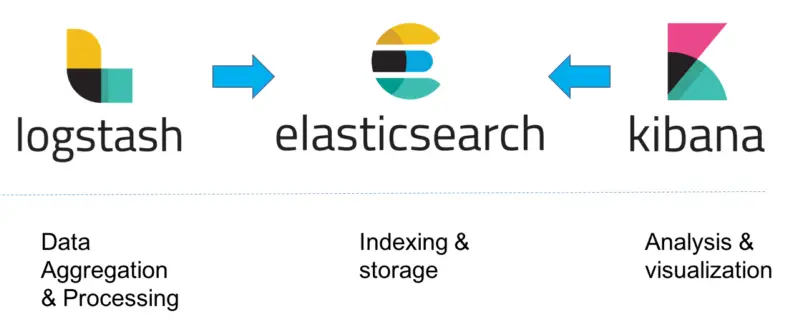
The ELK stack (Elasticsearch, Logstash, and Kibana) has been built to deliver actionable insights in real time from almost any type of data. In this tutorial we will learn how to install them and configure its plugins to poll relevant metrics from WildFly or JBoss EAP.
The various components in the ELK Stack have been designed to interact nicely with each other without too much hassle in the configuration. However, how the way you end up constructing the stack mostly depends on the environment and specific application requirements. For a small-sized development environment, the typical architecture will look as follows:
Let’s see how to install each of these components
Installing the ELK on Linux
Obviously the first requirement is to install all products (Docker images are also available on DockerHub anyway)
You can dowload the current stable version of logstash with:
wget https://artifacts.elastic.co/downloads/logstash/logstash-6.3.0.zip
You can dowload the current stable version of elasticsearch with:
https://artifacts.elastic.co/downloads/elasticsearch/elasticsearch-6.3.0.zip
You can dowload the current stable version of kibana with:
wget https://artifacts.elastic.co/downloads/kibana/kibana-6.3.0-linux-x86_64.tar.gz
If you are running Windows, just reach the Download page of each component and launch the installer file to have them installed on your machine.
If you don’t have WildFly installed, then download it from wildfly.org site and unzip it in order to install it:
wget http://download.jboss.org/wildfly/13.0.0.Final/wildfly-13.0.0.Final.zip
WildFly Data mining
Logstash configuration file will determine which data will be sent to Elasticsearch for indexing, therefore it’s there the only configuration we need to apply.
A basic configuration file for Logstash has three sections:
- input : Inputs are the mechanism for passing log data to Logstash.
- filter : Filters are workhorses for processing inputs in the Logstash chain.
- output : Outputs are the final phase of the Logstash pipeline. An event may pass through multiple outputs during processing, but once all outputs are complete the event has finished its execution.
In the following logstash.conf configuration file, we are listening for input messages on port 7080 and outputting them on the default Elasticsearch port 9200 :
input {
	tcp {
	port => 7080
	}
}
filter {
	json {
	source => "message"
	}
}
output {
	elasticsearch {
	host => "127.0.0.1"
	}
}
In our case we will do the reverse, that is we will pull as input the statistics from wildfly. The first thing, in order to do that, is to create a management user that will authorize http access to server metrics. From the JBOSS_HOME:
$ ./add-user.sh -u admin -p Password1!
We will show how to gather statistics from a Datasource. You can choose any metric you like provided that you activate its statistics first. Use the following CLI to activate statistics from the ExampleDS:
/subsystem=datasources/data-source=ExampleDS:write-attribute(name=statistics-enabled,value=true)
Now as proof of concept, let’s open the browser and execute the following request:
If you enter the user and password from the management user, you should be able to see the current statistics from your pool. (Obviously you need one application which uses the ExampleDS datasource to see some meaningful data).
Configuring logstash to poll for metrics
Having done the WildFly configuration, let’s engineer a logstash.conf file to collect metrics from WildFly:
input {


  http_poller {
    urls => {
      pool_metrics => {
        method => "get"
        url => "http://localhost:9990/management/subsystem/datasources/data-source/ExampleDS/statistics/pool?include-runtime=true&recursive=true"
        headers => {
          "Content-Type" => "application/json"
        }
        auth => {
          user => "admin"
          password => "Password1!"
        }
      }
      jdbc_metrics => {
        method => "get"
        url => "http://localhost:9990/management/subsystem/datasources/data-source/ExampleDS/statistics/jdbc?include-runtime=true&recursive=true"
        headers => {
          "Content-Type" => "application/json"
        }
        auth => {
          user => "admin"
          password => "Password1!"
        }
      }
    }
    request_timeout => 30
    schedule => { cron => "* * * * * UTC"}
    codec => "json"
    type => "wildfly_datasource_exampleds_metrics"
  }
}


output {
  elasticsearch {

    # An index is created for each type of metrics input
    index => "logstash-%{type}"
  }

}
As you can see, the configuration file is quite intuitive. We will collect two kind of metrics (pool_metrics and jdbc_metrics) from the ExampleDS, scheduled on a cron basis. Data polling will occur once every minute (* * * * *) and will be send as output to elasticsearch.
Before starting logstash we need to enable the http poller and json encode filter in order to let the above configuration work. From the bin folder of logstatsh installation execute:
$ ./logstash-plugin install logstash-input-http_poller
$ ./logstash-plugin install logstash-filter-json_encode
Now start logstash by pointing to this configuration file. Assumed you have placed it in the upper config folder:
$ ./logstash -f ../config/logstash.conf
Logstash will start in a minute providing an output like that:
[2018-06-20T22:04:40,561][INFO ][logstash.inputs.http_poller] Registering http_poller Input {:type=>"wildfly_datasource_exampleds_metrics", :schedule=>{"cron"=>"* * * * * UTC"}, :timeout=>nil}
[2018-06-20T22:04:40,661][INFO ][logstash.pipeline        ] Pipeline started successfully {:pipeline_id=>"main", :thread=>"#<Thread:0xa210596 run>"}
[2018-06-20T22:04:40,844][INFO ][logstash.agent           ] Pipelines running {:count=>1, :running_pipelines=>[:main], :non_running_pipelines=>[]}
[2018-06-20T22:04:41,792][INFO ][logstash.agent           ] Successfully started Logstash API endpoint {:port=>9600}
Now it’s the turn of elastic search:
from the bin folder of its installation, run:
$ ./elasticsearch
You will see as output something like that:
[2018-06-20T22:04:09,261][INFO ][o.e.n.Node               ] [1VrMuHj] initialized
[2018-06-20T22:04:09,261][INFO ][o.e.n.Node               ] [1VrMuHj] starting ...
[2018-06-20T22:04:10,130][INFO ][o.e.t.TransportService   ] [1VrMuHj] publish_address {127.0.0.1:9300}, bound_addresses {[::1]:9300}, {127.0.0.1:9300}
[2018-06-20T22:04:10,262][WARN ][o.e.b.BootstrapChecks    ] [1VrMuHj] max file descriptors [4096] for elasticsearch process is too low, increase to at least [65536]
[2018-06-20T22:04:10,262][WARN ][o.e.b.BootstrapChecks    ] [1VrMuHj] max virtual memory areas vm.max_map_count [65530] is too low, increase to at least [262144]
[2018-06-20T22:04:13,631][INFO ][o.e.c.s.MasterService    ] [1VrMuHj] zen-disco-elected-as-master ([0] nodes joined)[, ], reason: new_master {1VrMuHj}{1VrMuHjoR-2HC_ZGbXJTjQ}{x_20C6IsRoqUOgNf7T0ZMg}{127.0.0.1}{127.0.0.1:9300}{ml.machine_memory=12284903424, xpack.installed=true, ml.max_open_jobs=20, ml.enabled=true}
[2018-06-20T22:04:13,649][INFO ][o.e.c.s.ClusterApplierService] [1VrMuHj] new_master {1VrMuHj}{1VrMuHjoR-2HC_ZGbXJTjQ}{x_20C6IsRoqUOgNf7T0ZMg}{127.0.0.1}{127.0.0.1:9300}{ml.machine_memory=12284903424, xpack.installed=true, ml.max_open_jobs=20, ml.enabled=true}, reason: apply cluster state (from master [master {1VrMuHj}{1VrMuHjoR-2HC_ZGbXJTjQ}{x_20C6IsRoqUOgNf7T0ZMg}{127.0.0.1}{127.0.0.1:9300}{ml.machine_memory=12284903424, xpack.installed=true, ml.max_open_jobs=20, ml.enabled=true} committed version [1] source [zen-disco-elected-as-master ([0] nodes joined)[, ]]])
[2018-06-20T22:04:13,785][INFO ][o.e.x.s.t.n.SecurityNetty4HttpServerTransport] [1VrMuHj] publish_address {127.0.0.1:9200}, bound_addresses {[::1]:9200}, {127.0.0.1:9200}
[2018-06-20T22:04:13,786][INFO ][o.e.n.Node               ] [1VrMuHj] started
[2018-06-20T22:04:15,633][WARN ][o.e.x.s.a.s.m.NativeRoleMappingStore] [1VrMuHj] Failed to clear cache for realms [[]]
[2018-06-20T22:04:15,764][INFO ][o.e.l.LicenseService     ] [1VrMuHj] license [9444fad5-a246-4db2-ae3b-78bade2c1be6] mode [basic] - valid
[2018-06-20T22:04:15,842][INFO ][o.e.g.GatewayService     ] [1VrMuHj] recovered [2] indices into cluster_state
[2018-06-20T22:04:17,996][INFO ][o.e.c.r.a.AllocationService] [1VrMuHj] Cluster health status changed from [RED] to [YELLOW] (reason: [shards started [[.kibana][0]] ...]).
The initial settings for Elasticsearch are just fine if you want to start to play with it, however you will need to increase both the JVM memory settings and the OS max file descriptors to have a robust environment.
The last one is kibana, which can be started pretty much the same way from the bin folder:
$ ./kibana
A successful statrtup will provide the following output:
log [20:04:30.500] [info][listening] Server running at http://localhost:5601
Managing metrics from kibana
From now on we will use kibana web application to display the metrics collected from WildFly. You can reach kibana home page at: http://localhost:5601
From there, the first thing is to define which Elasticsearch indexes will be used. Choose the Management option from the left side and click on Index Management in the Elasticsearch panel:
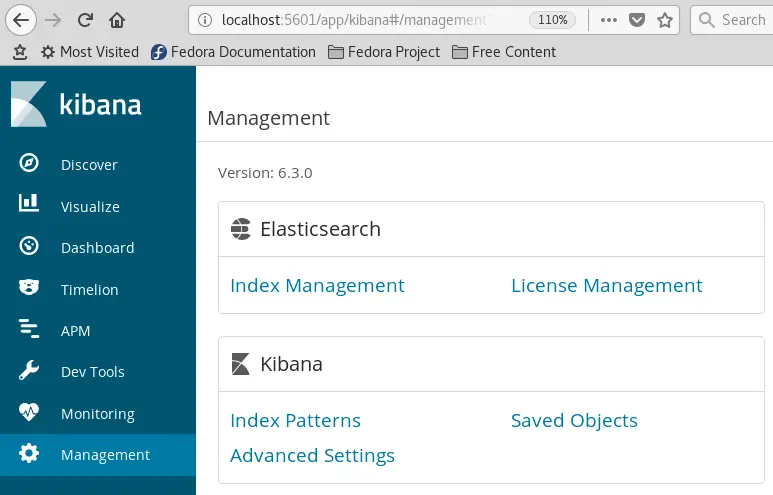
At the moment, just one index is available named wildfly_datasource_exampleds_metrics. Check it as in the following picture:

Now click the Discover link in the top navigation bar. By default, this will show you all of the log data over the last 15 minutes. You should see a histogram with log events, with log messages below:
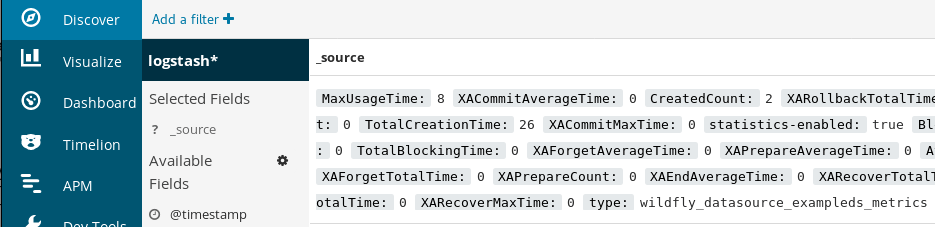
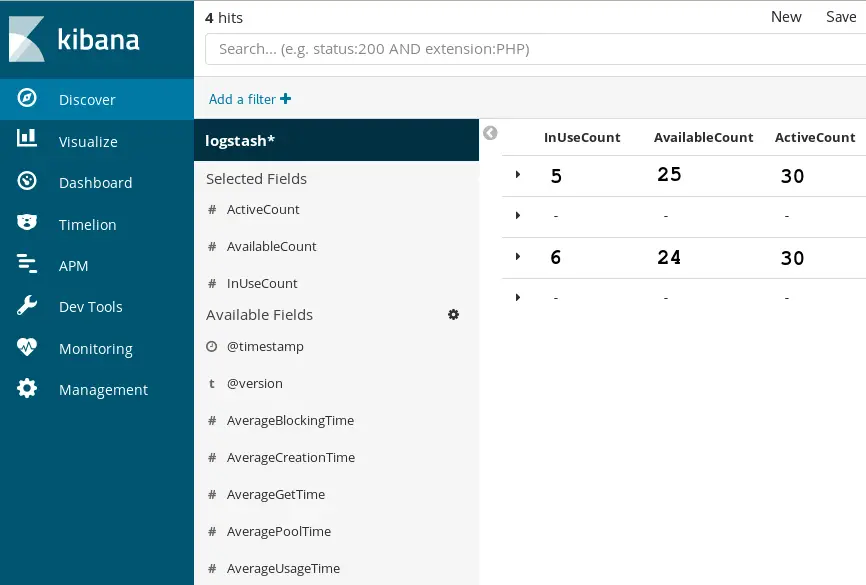
Within the Discover Menu, you can choose which fields will be used to represent your Data by clicking on the Available fields:
When you are done with your filter, move into the Visualize Menu:

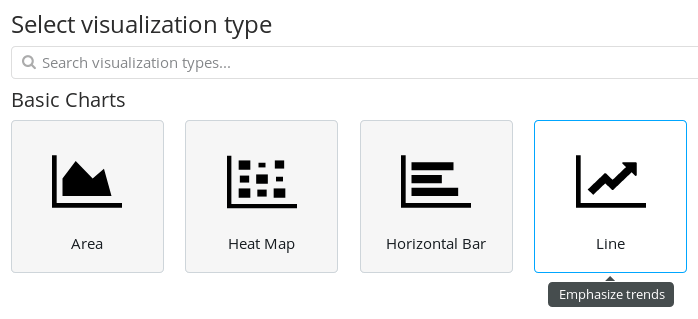
Click on Create a Visualization. You will be taken to the next menu where you will need to pick up the appropriate Visualization for your Data. Choose Line as Chart:
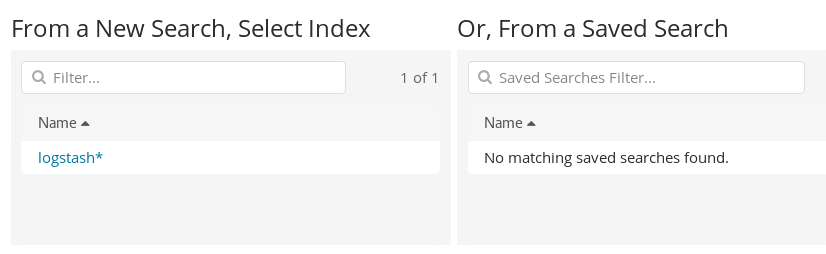
A chart needs to reference an available Index. Select the index pattern for the indices that contain the data you want to visualize. This opens the visualization builder with a wildcard query that matches all of the documents in the selected indices.
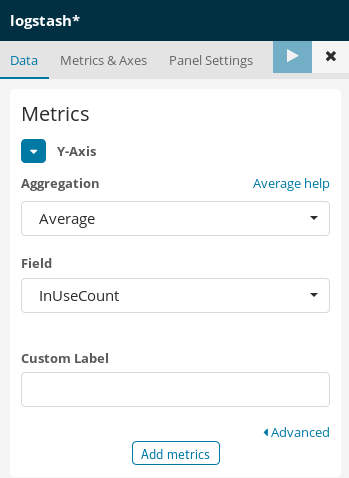
Bar, line, or area chart visualizations use metrics for the y-axis and buckets for the x-axis. Buckets are analogous to SQL GROUP BY statements.
We will place in the Y-Axis the actual metric data from our Datasource. There are several Aggregation available. We will choose the Average aggregation based on the field “InUseCount”:
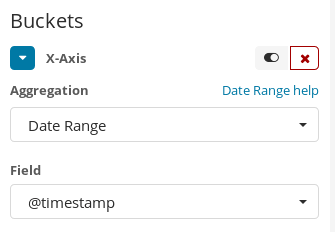
Next, the X-Axis which is related to the timescale. Choose as field the @timestamp which is the time when this metric has been collected:
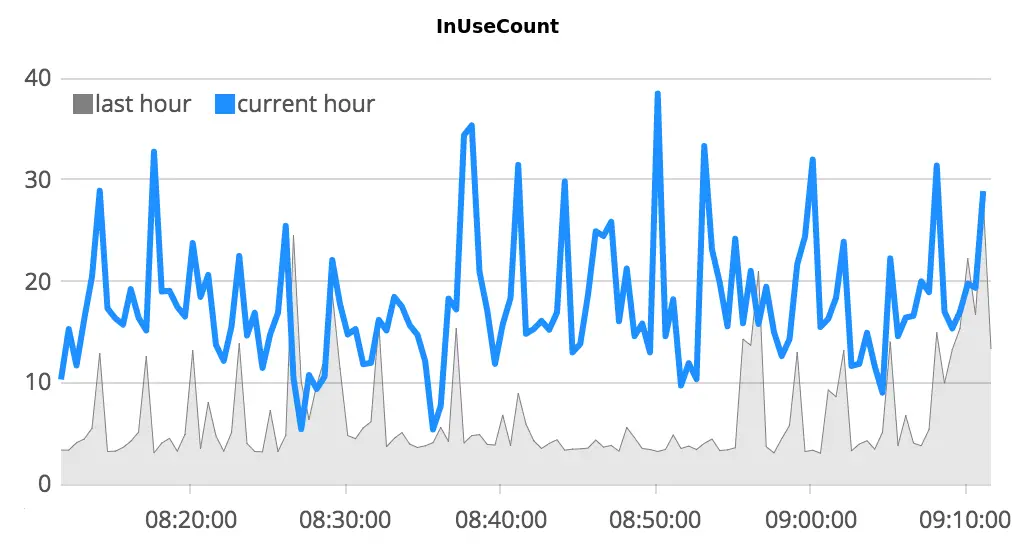
That’s all. Once that you have created a Visualization, you can add it to a Dashboard which is made up of a combination of visualization. So far we have just the Graph visualization which reports the following data when our application is under load:
In this tutorial we have just provided a basic demonstration of how you can collect and visualize your Data using the ELK stack. To improve your new ELK stack, you should have a look into gathering and filtering your data, and creating Kibana dashboards. You may also want to gather system metrics by using Topbeat with your ELK stack to allow periodically read system-wide and per-process CPU.