This article covers how to monitor Java Enterprise applications using OpenShift Container Platform 4.6. For the purpose of this example, we will be using JBoss Enterprise Application platform Expansion pack which empowers JBoss EAP with Microprofile API, such as the Metrics API.
The monitoring solution we will use is Prometheus which is available out of the box in OpenShift 4.6 and later. The advantage of using the OpenShift’s embedded Prometheus is that you will use a single Console (the Development Console of OpenShift) to view and manage your metrics.
Older versions of OpenShift can still use Prometheus, however you will need to install it separately and access metric through its Console.
For those who are new to it, Prometheus, is an increasingly popular toolkit that provides monitoring and alerts across applications and servers.
The primary components of Prometheus include
- Prometheus server which scrapes and stores time series data
- A push gateway for supporting short-lived jobs
- Special-purpose exporters for services like HAProxy, StatsD, Graphite, etc.
- An Alertmanager to handle alerts
- Client libraries for instrumenting application code
To run our demo, we will use Code Ready Containers (CRC), which provides simple startup to an OpenShift single node cluster. If you want to learn how to get started with CRC, check this tutorial:
Enabling application monitoring on OpenShift
Before starting CRC, you need to set the property “enable-cluster-monitoring” to true as the monitoring, alerting, and telemetry are disable by default on CRC.
$ crc config set enable-cluster-monitoring true
Next start CRC:
$ crc start
   . . . . .

Started the OpenShift cluster.

The server is accessible via web console at:
  https://console-openshift-console.apps-crc.testing

Log in as administrator:
  Username: kubeadmin
  Password: T3sJD-jjueE-2BnHe-ftNBw

Log in as user:
  Username: developer
  Password: developer

Use the 'oc' command line interface:
  $ eval $(crc oc-env)
  $ oc login -u developer https://api.crc.testing:6443
Now you can login as kubeadmin user:
$ oc login -u kubeadmin https://api.crc.testing:6443
Now, in order to enable the embedded Prometheus, we will edit the cluster-monitoring-config ConfigMap in the openshift-monitoring namespace. We need to set the attribute “techPreviewUserWorkload” to true:
$ oc -n openshift-monitoring edit configmap cluster-monitoring-config
And set the techPreviewUserWorkload setting to true under data/config.yaml:
apiVersion: v1
kind: ConfigMap
metadata:
  name: cluster-monitoring-config
  namespace: openshift-monitoring
data:
  config.yaml: |
    techPreviewUserWorkload:
      enabled: true
Great. You will see that in a minute the Prometheus, Thanos and Alert Manager Pods will start:
$ oc get pods -n openshift-monitoring
NAME                                           READY   STATUS    RESTARTS   AGE
alertmanager-main-0                            5/5     Running   0          58d
alertmanager-main-1                            5/5     Running   0          58d
alertmanager-main-2                            5/5     Running   0          58d
cluster-monitoring-operator-686555c948-7lq8z   2/2     Running   0          58d
grafana-6f4d96d7fd-5zz9p                       2/2     Running   0          58d
kube-state-metrics-749954d685-h9nfx            3/3     Running   0          58d
node-exporter-5tk5t                            2/2     Running   0          58d
openshift-state-metrics-587d97bb47-rqljs       3/3     Running   0          58d
prometheus-adapter-85488fffd6-8qpdz            1/1     Running   0          2d8h
prometheus-adapter-85488fffd6-nw9kz            1/1     Running   0          2d8h
prometheus-k8s-0                               7/7     Running   0          58d
prometheus-k8s-1                               7/7     Running   0          58d
prometheus-operator-658ccb589c-qbgwq           2/2     Running   0          58d
telemeter-client-66c98fb87-7qfv5               3/3     Running   0          58d
thanos-querier-7cddb86d6c-9vwmc                5/5     Running   0          58d
thanos-querier-7cddb86d6c-hlmb7                5/5     Running   0          58d
Deploying an Enterprise application which produces Metrics
The application we will monitor is a WildFly quickstart which contains MicroProfile Metrics in a REST Endpoint: https://github.com/wildfly/quickstart/tree/master/microprofile-metrics
The main method in the REST Endpoint calculates if a number is a prime number, using the following annotations from the Metrics API:
@GET
@Path("/prime/{number}")
@Produces(MediaType.TEXT_PLAIN)
@Counted(name = "performedChecks", displayName="Performed Checks", description = "How many prime checks have been performed.")
@Timed(name = "checksTimer", absolute = true, description = "A measure of how long it takes to perform the primality test.", unit = MetricUnits.MILLISECONDS)
@Metered(name = "checkIfPrimeFrequency", absolute = true)
public String checkIfPrime(@PathParam("number") long number) {
   // code here
}
To get started, we will create a project named “xp-demo”:
$ oc new-project xp-demo
Then, in order to run the EAP XP application, we need at at first deploy the required template files for JBoss EAP Expansion Pack:
oc replace --force -n openshift -f https://raw.githubusercontent.com/jboss-container-images/jboss-eap-openshift-templates/eap-xp2/jboss-eap-xp2-openjdk11-openshift.json

oc replace --force -n openshift -f https://raw.githubusercontent.com/jboss-container-images/jboss-eap-openshift-templates/eap-xp2/templates/eap-xp2-basic-s2i.json
Now we can deploy the actual application, using as template parameter the EAP image jboss-eap-xp2-openjdk11-openshift:2.0:
oc new-app --template=eap-xp2-basic-s2i -p APPLICATION_NAME=eap-demo -p EAP_IMAGE_NAME=jboss-eap-xp2-openjdk11-openshift:2.0 -p EAP_RUNTIME_IMAGE_NAME=jboss-eap-xp2-openjdk11-runtime-openshift:2.0 -p IMAGE_STREAM_NAMESPACE=openshift -p SOURCE_REPOSITORY_URL=https://github.com/wildfly/quickstart -p SOURCE_REPOSITORY_REF=23.0.0.Final -p CONTEXT_DIR="microprofile-metrics"
Watch for the EAP Pods to come up:
$ oc get pods
NAME                               READY   STATUS      RESTARTS   AGE
eap-demo-1-6dw28                   1/1     Running     0          22h
eap-demo-1-deploy                  0/1     Completed   0          22h
eap-demo-2-build                   0/1     Completed   0          22h
eap-demo-build-artifacts-1-build   0/1     Completed   0          22h
Since the EAP metrics are available on port 9990, we will create an additional service named “eap-xp2-basic-app-admin” which targets the port 9990 of the “eap-demo” application:
apiVersion: v1
kind: Service
metadata:
  annotations:
  labels:
    app: eap-xp2-basic-s2i-admin
    app.kubernetes.io/component: eap-xp2-basic-s2i-admin
    app.kubernetes.io/instance: eap-xp2-basic-s2i-admin
    application: eap-xp2-basic-app-admin
    template: eap-xp2-basic-s2i-admin
    xpaas: "1.0"
  name: eap-xp2-basic-app-admin
  namespace: xp-demo
spec:
  ports:
    - name: admin
      port: 9990
      protocol: TCP
      targetPort: 9990
  selector:
    deploymentConfig: eap-demo
  sessionAffinity: None
  type: ClusterIP
status:
  loadBalancer: {}
Save it in a file, for example service.yml and create it with:
$ oc create -f service.yml
Check that the list of services now include also the “eap-xp2-basic-app-admin” bound to port 9990:
$ oc get services
NAME                      TYPE        CLUSTER-IP     EXTERNAL-IP   PORT(S)    AGE
eap-demo                  ClusterIP   10.217.4.139   <none>        8080/TCP   22h
eap-demo-ping             ClusterIP   None           <none>        8888/TCP   22h
eap-xp2-basic-app-admin   ClusterIP   10.217.5.217   <none>        9990/TCP   22h
As optional step, we have exposed also a Route for this service, on the path “/metrics” so that we can check metrics also from outside the cluster:
$ oc expose svc/eap-xp2-basic-app-admin --path=/metrics
Here’s the available Routes:
$ oc get routes
NAME          HOST/PORT                              PATH       SERVICES                  PORT    TERMINATION     WILDCARD
admin-route   admin-route-xp-demo.apps-crc.testing   /metrics   eap-xp2-basic-app-admin   admin                   None
eap-demo      eap-demo-xp-demo.apps-crc.testing                 eap-demo                  <all>   edge/Redirect   None
The last resource we need to create, is a ServiceMonitor which will be used by Prometheus to select the service to monitor. For this purpose, we will include a selector matching the “eap-xp2-basic-s2i-admin”:
apiVersion: monitoring.coreos.com/v1
kind: ServiceMonitor
metadata:
  labels:
    k8s-app: prometheus-example-monitor
  name: prometheus-example-monitor
  namespace: xp-demo
spec:
  endpoints:
  - interval: 30s
    port: admin
    scheme: http
  selector:
    matchLabels:
      app: eap-xp2-basic-s2i-admin
Save it in a file, for example servicemonitor.yml and create it with:
$ oc create -f servicemonitor.yml
As Prometheus by default will scrape metrics on the “/metrics” URI, nothing else but the service binding is required.
Now let’s turn to the Web admin console.
Accessing Metrics from the Enterprise application
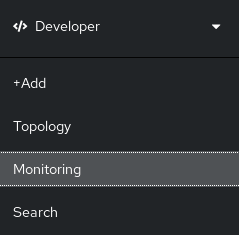
Log into the OpenShift console and Switch to the Developer tab. You will see that a Monitoring tab is available:
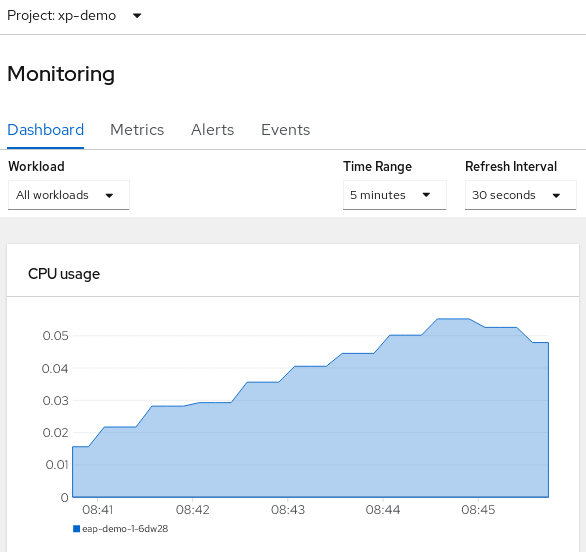
Select the Montoring Tab. You will enter in the Monitoring Dashboard which contains a set of line charts (CPU, Memory, Bandwidth, Packets transmitted) for the EAP Pods:
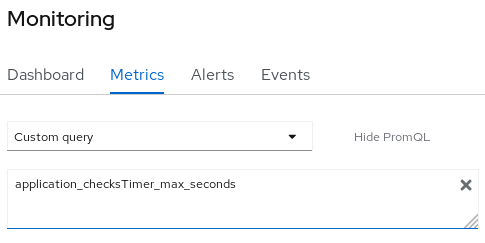
Now switch to the “Metrics” tab. From there you can either select one of the metrics seen in the Dashboards or you can opt for Custom Metrics. We will choose a Custom Metric. Which one? to know the available metrics you can query the admin-route-xp-demo.apps-crc.testing which targets EAP on port 9990:
Here is an excerpt from it:
application_duplicatedCounter_total{type="original"} 0.0
application_duplicatedCounter_total{type="copy"} 0.0
# HELP application_org_wildfly_quickstarts_microprofile_metrics_PrimeNumberChecker_parallelAccess_current Number of parallel accesses
# TYPE application_org_wildfly_quickstarts_microprofile_metrics_PrimeNumberChecker_parallelAccess_current gauge
application_org_wildfly_quickstarts_microprofile_metrics_PrimeNumberChecker_parallelAccess_current 0.0
# TYPE application_org_wildfly_quickstarts_microprofile_metrics_PrimeNumberChecker_parallelAccess_max gauge
application_org_wildfly_quickstarts_microprofile_metrics_PrimeNumberChecker_parallelAccess_max 0.0
# TYPE application_org_wildfly_quickstarts_microprofile_metrics_PrimeNumberChecker_parallelAccess_min gauge
application_org_wildfly_quickstarts_microprofile_metrics_PrimeNumberChecker_parallelAccess_min 0.0
# HELP application_org_wildfly_quickstarts_microprofile_metrics_PrimeNumberChecker_highestPrimeNumberSoFar Highest prime number so far.
# TYPE application_org_wildfly_quickstarts_microprofile_metrics_PrimeNumberChecker_highestPrimeNumberSoFar gauge
application_org_wildfly_quickstarts_microprofile_metrics_PrimeNumberChecker_highestPrimeNumberSoFar 13.0
# HELP application_org_wildfly_quickstarts_microprofile_metrics_PrimeNumberChecker_performedChecks_total How many prime checks have been performed.
# TYPE application_org_wildfly_quickstarts_microprofile_metrics_PrimeNumberChecker_performedChecks_total counter
application_org_wildfly_quickstarts_microprofile_metrics_PrimeNumberChecker_performedChecks_total 7.0
# TYPE application_injectedCounter_total counter
application_injectedCounter_total 0.0
# TYPE application_checkIfPrimeFrequency_total counter
application_checkIfPrimeFrequency_total 7.0
# TYPE application_checkIfPrimeFrequency_rate_per_second gauge
application_checkIfPrimeFrequency_rate_per_second 0.009764570078023867
# TYPE application_checkIfPrimeFrequency_one_min_rate_per_second gauge
application_checkIfPrimeFrequency_one_min_rate_per_second 0.01514093009622217
# TYPE application_checkIfPrimeFrequency_five_min_rate_per_second gauge
application_checkIfPrimeFrequency_five_min_rate_per_second 0.015280392552156003
# TYPE application_checkIfPrimeFrequency_fifteen_min_rate_per_second gauge
application_checkIfPrimeFrequency_fifteen_min_rate_per_second 0.0067481340497595925
# TYPE application_checksTimer_rate_per_second gauge
application_checksTimer_rate_per_second 0.009764593427401155
# TYPE application_checksTimer_one_min_rate_per_second gauge
application_checksTimer_one_min_rate_per_second 0.01514093009622217
# TYPE application_checksTimer_five_min_rate_per_second gauge
application_checksTimer_five_min_rate_per_second 0.015280392552156003
# TYPE application_checksTimer_fifteen_min_rate_per_second gauge
application_checksTimer_fifteen_min_rate_per_second 0.0067481340497595925
# TYPE application_checksTimer_min_seconds gauge
application_checksTimer_min_seconds 1.301E-5
# TYPE application_checksTimer_max_seconds gauge
application_checksTimer_max_seconds 1.08862E-4
# TYPE application_checksTimer_mean_seconds gauge
application_checksTimer_mean_seconds 2.3666899949653865E-5
# TYPE application_checksTimer_stddev_seconds gauge
application_checksTimer_stddev_seconds 2.4731858133453515E-5
# HELP application_checksTimer_seconds A measure of how long it takes to perform the primality test.
# TYPE application_checksTimer_seconds summary
application_checksTimer_seconds_count 7.0
For example, we will be checking a Performance metric, the “application_checksTimer_max_seconds” metric, which is the maximum number (in seconds) required to check for prime number:
Now let’s start requesting the “/prime” endpoint, passing a number to be checked, for example: https://eap-demo-xp-demo.apps-crc.testing/prime/13
You will see that the Custom Metric will track our metric:

Adding Alerts for relevant metrics
Alerting with Prometheus is separated into two parts. Alerting rules in Prometheus servers send alerts to an Alertmanager. The Alertmanager then manages those alerts, including silencing, inhibition, aggregation and sending out notifications via methods such as email, on-call notification systems, and chat platforms.
As an example, we will add a sample alert to capture the value of “application_checksTimer_max_seconds” when it goes over a certain threshold (3 ms). Here is our sample metric file:
apiVersion: monitoring.coreos.com/v1
kind: PrometheusRule
metadata:
  name: example-alert
  namespace: xp-demo
spec:
  groups:
  - name: performance
    rules:
    - alert: CheckTimerAlert
      expr: version{job="application_checksTimer_max_seconds"} > 0.003
Save it in a file, for example alert.yml and create it with:
$ oc create -f alert.yml
Let’s request some time-consuming prime numbers calculations such as: https://eap-demo-xp-demo.apps-crc.testing/prime/10001891
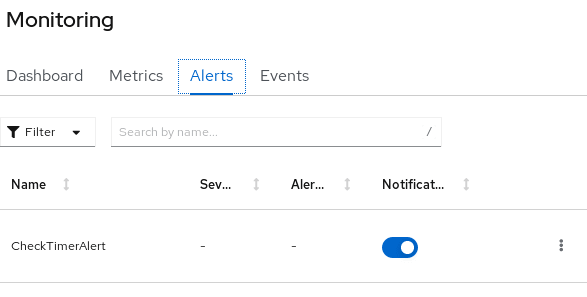
You will now see that as the count for that metric goes above the defined threshold (5), an alert will be available in the “Alerts” tab:
Clicking on it, you will see the condition which activated the Alert:

That’s all.
We have just covered how to enable application monitoring on OpenShift 4.6 (or newer). We have therefore enabled the embedded Prometheus service and deployed an Enterprise application which emits metrics that can be scraped by Prometheus.
Next, we have showed how this metrics can be captured by OpenShift developer Console and how to bind alerts for critical metrics.