The error java.lang.OutOfMemoryError:Metaspace indicates that you have exhausted an area of JVM which serves as a registry for your application’s Class Metadata. This article is a step-by-step guide to fix Java Metaspace errors with Java 17’s elastic metaspace (JEP 387), diagnostic tools like jcmd, and best practices for JVM configuration.
Problem Description
At runtime, the execution of a Java application triggers the following Exception:
java.lang.OutOfMemoryError: Metaspace
	at java.base/java.lang.ClassLoader.defineClass1(Native Method)
	at java.base/java.lang.ClassLoader.defineClass(ClassLoader.java:1017)
	at java.base/java.lang.ClassLoader.defineClass(ClassLoader.java:879)
A common symptom is that your application is not responsive any more. As a matter of fact, while the JVM might attempt to recover this Error by unloading classes,the application’s behavior might become unpredictable due to missing classes or incomplete information in Metaspace.
Cause of the Issue
To understand the cause of a java.lang.OutOfMemoryError: Metaspace let’s see where this area is located within the JVM:
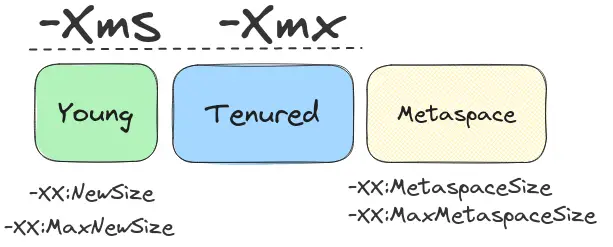
Since the JVM loads classes dynamically during program execution, the Metadata for each class (method, and other runtime artifacts) are stored in the Metaspace. Unlike the older PermGen, the Metaspace dynamically adjusts its size based on the application’s demands and it is garbage-collected by the JVM when the loaded classes are unloaded or become obsolete.
Therefore, the cause of the issue is that you have exhausted the area of memory where the JVM stores the classes’ Metadata information.
Solution
Starting with Java 17, the JVM includes Elastic Metaspace (via JEP 387), which more aggressively returns unused metaspace memory to the operating system This enhancement significantly reduces the risk of running into OutOfMemoryError: Metaspace in many applications.
Key Recommendations:
- Upgrade to JDK 17 or later to benefit from elastic metaspace and overall improved memory efficiency.
- Remove explicit
-XX:MaxMetaspaceSizeunless absolutely needed. In modern JVMs, it’s often no longer necessary and can inadvertently lead to premature OOM conditions
Monitoring Metaspace growth
You should monitor the Metaspace to understand if there is a genuine need for a larger Metaspace due to the high number of Metadata your application requires. This can help to determine the -XX:MaxMetaspaceSize for older JDK versions which can still benefit from this setting
Step 1: Monitor the Metaspace growth
Firstly, we need to monitor your Java Process. You can do it either from the Command Line or using a Visual Tool.
We will show at first how to monitor your JVM using a tool such as JConsole. Launch jconsole:
jconsole
Then, select your Java process and choose the “Memory” Tab. From the Combo select “Memory pool Metaspace“.
The following graph shows application which initially loaded an high number of classes. However there is no growing trend for this area of Memory:

In a scenario where there’s an occasional burst of Classloading, you can try increasing the space you need to store Class metadata. In modern Java versions, the amount of native memory that is available for Class metadata is by default unlimited.
Therefore, if you are seeing the java.lang.OutOfMemoryError: Metaspace error you can either increase your current setting for -XX:MaxMetaspaceSize or simply remove it, to use an unlimited setting. By removing the is the best and recommended option in modern JDKs.
For example:
java -XX:MaxMetaspaceSize=256M -XX:MetaspaceSize=128M -XX:MaxMetaspaceFreeRatio=60 YourMainClass
-XX:MaxMetaspaceSize=256M: Sets the maximum size of the Metaspace to 256 megabytes.-XX:MetaspaceSize=128M: Sets the initial size of the Metaspace to 128 megabytes.-XX:MaxMetaspaceFreeRatio=60: Sets the maximum Metaspace free ratio to 60%. When the percentage of free space in the metaspace drops below this threshold, the JVM will attempt to free up space by unloading classes that are no longer in use.
Besides the Metaspace capacity, pay attention to the Compressed class space maximum capacity. The CompressedClassSpaceSize is the amount of virtual memory reserved for compressing Class MetaData. Therefore, MaxMetaspaceSize should be larger than CompressedClassSpaceSize.
If MaxMetaspaceSize is set smaller than CompressedClassSpaceSize, the JVM auto adjusts CompressedClassSpaceSize using this formula:
CompressedClassSpaceSize = MaxMetaspaceSize - 2 * InitialBootClassLoaderMetaspaceSize
For instance, consider the following settings, resulting in a 768M space for class metadata, with 756M (assuming an initial boot class loader Metaspace size of 6M) allocated for compressed class pointers:
XX:MetaspaceSize=768M -XX:MaxMetaspaceSize=768M -XX:CompressedClassSpaceSize=1536M
On the other hand, the following scenario shows an evident issue with the amount of memory, which cannot be fully recovered:

In this scenario you need to continue your analysis by inspecting which Classes are causing an overflow of the Metaspace area.
Monitoring the Metaspace from the Command Line:
There are several command line tool that can inspect the JVM Memory. Fistly, determine the PID of your Java application:
jps
Then, from the Command Line, you can monitor the growth of the Metaspace with the jcmd tool:
watch jstat -gcmetacapacity (PID)
For example, here is a sample output:
MCMN   MCMX      MC       CCSMN CCSMX       CCSC    YGC   FGC    FGCT    CGC    CGCT
0.0   374784.0  140360.0  0.0   253952.0    21168.0  23     0    0.000     6    0.046
We are mostly interested in the first three columns which are:
- MCMN: Minimum metaspace capacity (kB).
- MCMX: Maximum metaspace capacity (kB).
- MC: Metaspace capacity (kB).
A steady growth of the MC attribute hints to a possible issue or leak with your application code. If this is the case, check “Step 2” to collect further details on your Classes.
Another option to monitor the MetaSpace usage is the JVM parameter NativeMemoryTracking, which you can add to the start up parameters. For example:
-XX:+UnlockDiagnosticVMOptions -XX:NativeMemoryTracking=detail -XX:+PrintNMTStatistics
When you enable the Native Memory Tracking, you can request a report on the JVM memory usage using the following command:
$ jcmd <pid> VM.native_memory
If you check at the jcmd output, you will find at the bottom, the amount of native memory committed in the Internal (committed) section
Total: reserved=1334532KB, committed=369276KB
-                 Java Heap (reserved=524288KB, committed=132096KB)
                            (mmap: reserved=524288KB, committed=132096KB)

-                     Class (reserved=351761KB, committed=112629KB)
                            (classes #19111)
                            (  instance classes #17977, array classes #1134)
                            (malloc=3601KB #66765)
                            (mmap: reserved=348160KB, committed=109028KB)
                            (  Metadata:   )
                            (    reserved=94208KB, committed=92824KB)
                            (    used=85533KB)
                            (    free=7291KB)
                            (    waste=0KB =0.00%)
                            (  Class space:)
                            (    reserved=253952KB, committed=16204KB)
                            (    used=12643KB)
                            (    free=3561KB)
                            (    waste=0KB =0.00%)
In the line beginning with Metaspace, look for the used value. This is the amount of space the JVM uses for loaded classes. The committed value is the amount of space available for chunks. The reserved value is the amount of space reserved (but not necessarily committed) for metadata.
Step 2: Find the Top loaded classes
In order to find which are the top loaded Classes in your JVM, there are several command line and visual tools that can provide clues in your search. Here is a list of the most useful command line tools that you can use:
- Apply the option -verbose:class when starting the JDK:
java -verbose:class
This option logs messages whenever a class is loaded, unloaded, or verified by the JVM class loader.
- Run jmap -clstats:
Find the PID of the Java application and execute the jmap command:
jmap -clstats <PID>
This option provides a snapshot of the current state of class loading within your application.
- Run jcmd GC.class_histogram
Find the Java PID and execute the jcmd command passing as argument GC.class_histogram
jcmd <PID> GC.class_histogram
- Acquire an Heap Dump and check top loaded Classes
By taking an Heap Dump of your JVM, you can find even more details such as:
- Dominator tree analysis to identify potential memory leaks.
- Retained size analysis to see which objects are preventing garbage collection.
- Class loading information within the heap context.
If you want to know more about generating an Heap Dump, check this article: How to generate an Heap Dump in Java . In a nutshell, you can use the jmap command line to trigger a Heap Dump:
jmap -dump:format=b,file=dump.hprof <PID>
Then, open the Heap Dump with your favourite tool. For example JVisualVM. From the Heap Dump, you can look for duplicate classes, especially those loading your application classes.
The simplest way to do that, is using the OQL console. Within the OQL Console you can execute OQL queries to perform ad hoc analysis on your classes. For example, by executing the following query, you can have a list of class loaded from each Classloader:
select map(sort(map(heap.objects('java.lang.ClassLoader'), '{loader: it, count: it.classes.elementCount }'), 'lhs.count < rhs.count'), 'toHtml(it) + ""')
The following picture shows our findings on a sample Java Application that reproduces the problem. ( See at the bottom of this article for the reproducer).
In our example, there’s a Dynamic ClassLoader that loads in a loop new Classes. By inspecting the references of this ClassLoader we can trace the Class responsible for the issue, which is MyClass:

Additionally, to have more insights on WildFly, you can run this OQL which is specific to jboss Classes:
SELECT module.name.value.toString() FROM org.jboss.modules.ModuleClassLoader
By using the steps in this section, you should be able to detect the Root cause which causes an excessive usage of the Metaspace area.
OutOfMemoryError: Metaspace on OpenShift/Kubernetes
When using OpenJDK Image on OpenShift/Kubernetes, the default maximum value for the Metaspace is XX:MaxMetaspaceSize=100m. You might have noticed that setting this value through the JAVA_OPTIONS environment variable, doesn’t work as the default value is appended to the bottom:
VM Arguments: -Xms128m -Xmx1024m -XX:MetaspaceSize=128M -XX:MaxMetaspaceSize=256m -XX:AdaptiveSizePolicyWeight=90 -XX:MaxMetaspaceSize=100m -XX:+ExitOnOutOfMemoryError
The correct way to set the MaxMetaspaceSize is through the GC_MAX_METASPACE_SIZE environment variable. For example, if you are using a deployment.yaml file to deploy your application with JKube, the following settings will override the default values for the MaxMetaspaceSize and MaxMetaspaceSize:
spec:
  template:
    spec:
      containers:
      - env:
        - name: JAVA_OPTIONS
          value: '-Xms128m -Xmx1024m'
        - name: GC_MAX_METASPACE_SIZE
          value: 256
        - name: GC_METASPACE_SIZE
          value: 96
Conclusion
In conclusion, resolving the java.lang.OutOfMemoryError related to Metaspace requires a multifaceted approach that involves understanding, monitoring, and optimizing Metaspace usage in Java applications. We have covered this issues from many angles including the most recent JDK updates.
You can find a reproducer that can simulate the Error on our Website: https://github.com/fmarchioni/mastertheboss/blob/master/scripts/MetaspaceOOM.java