In this tutorial we will learn how to monitor Quarkus MicroProfile metrics using Prometheus open source monitoring solution.
Overview of Prometheus
Prometheus is an open-source monitoring and alerting platform. Its main features are:
- Targets discovery by configuration
- A multi-dimensional data model with time series data identified by metric name and key/value pairs
- A flexible query language (PromQL) to leverage the data model
- Autonomous single server nodes, therefore no reliance on distributed storage
- Time series data pull over HTTP
- Time series push is still supported using an intermediary gateway
- Multiple modes of graphing and dashboarding support
In order to exploit these features, Prometheus relies on several components:
- Prometheus core server which manages the series data
- Client libraries for instrumenting application code
- A Push Gateway for supporting short-lived jobs
- An Alert Manager to handle alerts
- Special-purpose exporters for services like HAProxy, StatsD, Graphite, etc.
Before installing Prometheus, we will create a simple Quarkus application which provides a couple of Application Metrics at the default address (http://localhost:8080/metrics).
@Path("/")
public class MetricsDemo {

    @GET
    @Path("/prime/{val}")
    @Produces("text/plain")
    @Timed(name = "maxPrimeFactorTimer", description = "A measure of how long it takes to calculate the Max Prime Factor.", unit = MetricUnits.MILLISECONDS)
    public long maxPrimeFactor(@PathParam long val) {
        System.out.println(val);
        long max_prime = -1;
        while (val % 2 == 0) {
            max_prime = 2;
            val >>= 1;
        }
        for (int i = 3; i <= Math.sqrt(val); i += 2) {
            while (val % i == 0) {
                max_prime = i;
                val = val / i;
            }
        }
        if (val > 2)
            max_prime = val;
        return max_prime;

    }

    @GET
    @Path("/hello")
    @Produces("text/plain")
    @Counted(description = "How many greetings", absolute = true, name = "countHello")
    public String countHello() {

        return "hello world!";
    }

}
As you can see the above REST Service includes a
- @Timed metric which tracks how frequently the method is invoked and how long it takes for each invocation of the method to complete.
- @Counted metric merely counts how many times the annotated method is accessed, counting up sequentially.
Make sure you have the following dependencies in place:
<dependency>
    <groupId>io.quarkus</groupId>
    <artifactId>quarkus-smallrye-metrics</artifactId>
</dependency>
<dependency>
    <groupId>io.quarkus</groupId>
    <artifactId>quarkus-resteasy</artifactId>
</dependency>
Then, start the Quarkus application with:
mvn install quarkus:dev
You can check that the REST Endpoints are working:
$ curl http://localhost:8080/prime/148592
251

$ curl http://localhost:8080/hello
hello world!
Now let’s monitor the above metrics with Prometheus.
Installing Prometheus
In order to start Prometheus you can either use the precompiled binaries or the Docker images which are available in DockerHub. We will download the latest binaries for your platform available from: https://prometheus.io/download/
Unzip the archive. You will have the following directory structure:
$ ls
console_libraries  data     NOTICE      prometheus.yml  rules.yml
consoles           LICENSE  prometheus  promtool
The Prometheus binary file is the core application. As we want to monitor Quarkus metrics which are available by default at localhost:8080, we will edit the prometheus.yml to include, at the end of the file, the Quarkus endpoint:
  # this is the configuration to poll metrics from Quarkus
  - job_name: 'metrics'
    scrape_interval: 15s

    static_configs:
      - targets: ['localhost:8080']
Next, start prometheus:
$ prometheus
Check that start was successful:
level=info ts=2020-10-09T09:06:59.456Z caller=main.go:673 msg="Server is ready to receive web requests."
At this point, you have a running Prometheus instance gathering data from our metrics. Let’s first validate the status of the target metrics by reaching the following URL: http://localhost:9090/targets
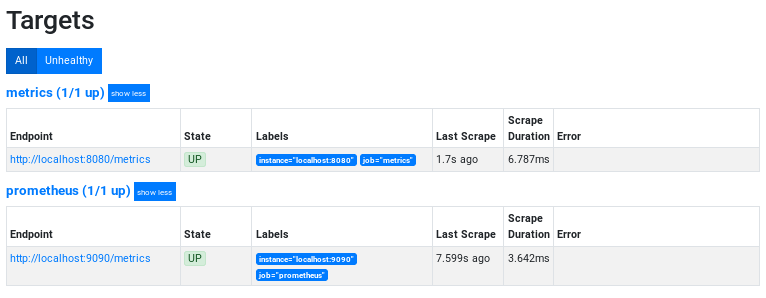
Perfect, the Quarkus metrics are available. Now let’s move to http://localhost:9090 where we will start checking some metrics.
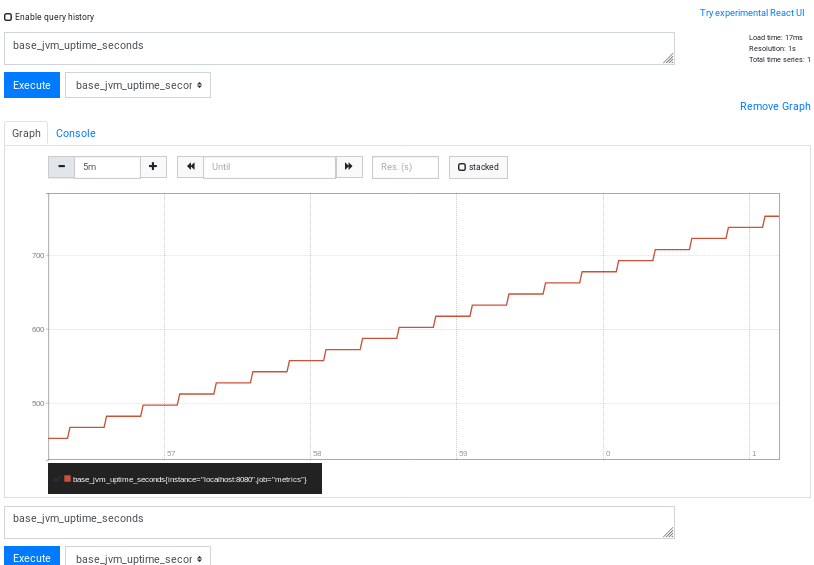
For example, let’s monitor a System Metric like “base_jvm_uptime_seconds”. Enter it into the Search Console and click Execute. Then, select the Graphh Tab to see the metrics in a graph choosing a Time Span:
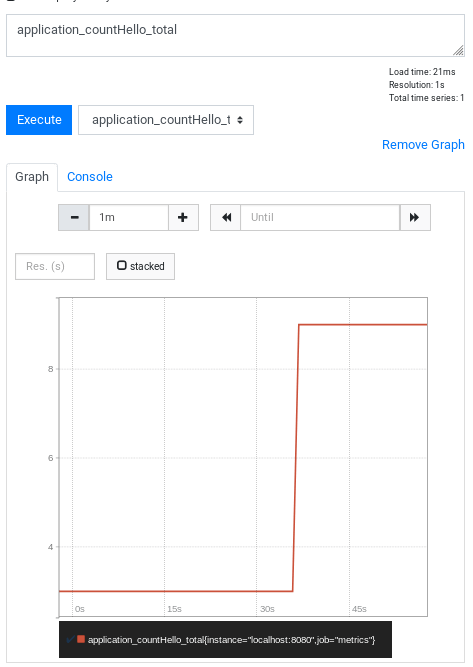
Much the same way, you can do for our Quarkus application metrics, which start with “application*” like the “application_countHello_total”:
Conclusion
Prometheus opensource monitoring is incredibly useful for Java applications. So far we have just scratched the surface on what you can do to monitor your applications.In the next tutorial we will learn how capture Alerts with the AlertManager component and visualize metrics using Grafana: Using Prometheus and Grafana to capture Alerts and visualize Metrics