This tutorial is a follow-up of JBoss Performance Tuning Tips and Hints. We will focus now on the incoming request flows as they cross the WildFly borders. And we will learn how to monitor the most critical attributes.
Tuning Undertow Workers
If you want to tune a complex product like a Java application server it is crucial that you understand the single layers that a request crosses before reaching the target component.
So let’s see the flow of a typical incoming request: it arrives from a Web layer and then crosses the EJB Container. This layer in turn connects to the Database:
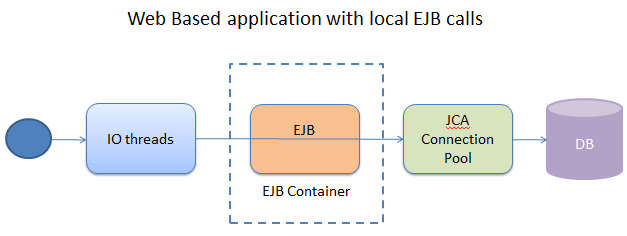
As you can see from the above picture, the thread that is driving a Web based request is Undertow XNIO thread which is created by Undertow handlers. Setting the correct amount of IO threads is crucial in this scenario, otherwise you will have a bottleneck at the beginning of your request.
This is the list of key attributes that you can configure in the IO subsystem:
- task-core-threads: specifies the starting number of threads for the worker task thread pool (default 2)
- task-max-threads: specifies the maximum number of threads for the worker task thread pool. If not set, the default value for is set to (cpuCount * 16)
- task-keepalive: specifies the number of milliseconds to keep non-core task threads alive (default 60000 milliseconds)
When a task thread is idle longer than the task-keepalive time and the number of threads is larger than task-core-threads at that moment, the task thread is discarded.
Here is how to set Task Threads attributes for them via CLI:
/subsystem=io/worker=default/:write-attribute(name=task-core-threads,value=25)

/subsystem=io/worker=default/:write-attribute(name=task-max-threads,value=100)

/subsystem=io/worker=default/:write-attribute(name=io-threads,value=100)
- If the number of task-core-threads/task-max-threads is insufficient, some of your HTTP requests can be rejected or slowed down.
- On the other hand, a too high number of task-core-threads/task-max-threads may have a negative impact on the CPU or trigger memory issues.
Monitoring HTTP Sessions
Still in the Web layer, you need to take into account the number of sessions which are running.
The parameter max-active-sessions determines how many active HTTP session the Web server can create. If session creation exceeds the max-active-sessions, then the Web server will start to passivate HTTP Session starting from the oldest ones.
Here is how to configure the max-active-sessions in jboss-web.xml:
<jboss-web>

   <max-active-sessions>200</max-active-sessions>

</jboss-web>
Then, keep monitoring the number of sessions using the CLI. In order to do that, you need to point to your /deployment path and enter into its undertow subsystem path:
/deployment=webapp.war/subsystem=undertow/:read-resource(include-runtime=true)

{

    "outcome" => "success",

    "result" => {

        "active-sessions" => 1,
        "context-root" => "/webapp",
        "server" => "default-server",
        "sessions-created" => 1,
        "virtual-host" => "default-host",
        "servlet" => {

            "Faces Servlet" => undefined,
            "demo.DownloadServlet" => undefined
        }
    }

}
Into the EJB Container
Once the IO thread reaches the EJB container, an EJB is picked up from the Pool (Stateless EJB) or pinned from the Cache (Stateful EJB). This is the second element that you need to consider: do you have enough resources in your EJB Container?
WildFly Stateless Session Beans by default are using a pool size which derives from the size of the IO worker pool. The IO worker pool in turn is computed based on the io system resources. As a proof of evidence, here is the current setting for the slsb-strict-max-pool:
/subsystem=ejb3/strict-max-bean-instance-pool=slsb-strict-max-pool/:read-resource(recursive=false)
{
    "outcome" => "success",
    "result" => {
        "derive-size" => "from-worker-pools",
        "max-pool-size" => 20,
        "timeout" => 5L,
        "timeout-unit" => "MINUTES"
    }
}
If you are using Stateful EJBs you will rather deal with a Cache of Beans that contain conversational data.
The Stateful cache by default uses a simple caching system which does not involve Passivation of data. This might be desirable in terms of performance, however if you need to use a Passivation mechanism in your application, you must learn how to configure the limits of your cache.
At first you need to enable the SFSB to use a passivation capable cache like the distributable:
/subsystem=ejb3/:write-attribute(name=default-sfsb-cache,value=distributable)
Then, you can configure the maximum number of SFSB allowed in the cache. For example, the distributable cache uses the infinispan passivation-store which allows a maximum number of 10000 elements in the cache
/subsystem=ejb3/passivation-store=infinispan/:write-attribute(name=max-size,value=10000)
Monitoring the EJB container
Next step is to monitor if your EJB container configuration is appropriate. As for the Web layer, you can obtain this information through your deployment unit, by digging into the ejb3 subsystem as follows:
/deployment=myapp.jar/subsystem=ejb3/stateless-session-bean=Manager/:read-resource(recursive=false,include-runtime=true,include-defaults=false)

{

    "outcome" => "success",
    "result" => {
        "component-class-name" => "Manager",
        "declared-roles" => [],
        "execution-time" => 0L,
        "invocations" => 0L,
        "methods" => {},
        "peak-concurrent-invocations" => 0L,
        "pool-available-count" => 20,
        "pool-create-count" => 1,
        "pool-current-size" => 1,
        "pool-max-size" => 20,
        "pool-name" => "slsb-strict-max-pool",
        "pool-remove-count" => 0,
        "run-as-role" => undefined,
        "security-domain" => "other",
        "timers" => [],
        "wait-time" => 0L,
        "service" => undefined
    }
}
Into the EIS
If you have enough resources in the EJB container, then the IO thread will continue its race to the last step which is usually the Database, but could be as well another EIS.
In case you are dealing with Database connections, you must acquire a connection from the pool. The key configuration parameter is max-pool-size which specifies the maximum number of connections for a pool. (Default 20).
Note: For that to work, you must allow the same number of connections (multiplied by your nodes) on the Database.
You can set your Connection pool max size to a different attribute using this CLI:
/subsystem=datasources/data-source=PostgreDS/:write-attribute(name=max-pool-size,value=100)
On your Database, make sure that 100 Connections are available. For example, with PostgreSQL:
max_connections = 100
shared_buffers = 80MB
In a similar way, if your Requests targets an external system through a Resource Adapter, then you will need to tune the resource-adapter min-pool-size and max-pool-size .
<resource-adapter>
  <archive>eis.rar</archive>

  <config-property name="Server">localhost</config-property>
  <config-property name="Port">19000</config-property>
  <transaction-support>XATransaction</transaction-support>
  <connection-definitions>
     <connection-definition class-name="com.acme.eis.ra.EISManagedConnectionFactory"
                            jndi-name="java:/eis/AcmeConnectionFactory"
                            pool-name="AcmeConnectionFactory">

        <config-property name="Name">Acme Inc</config-property>
        <pool>
           <min-pool-size>10</min-pool-size>
           <max-pool-size>100</max-pool-size>
        </pool>
        <security>
           <application/>
        </security>
     </connection-definition>
 </connection-definitions>
 <admin-objects>
     <admin-object class-name="com.acme.eis.ra.EISAdminObjectImpl"
                   jndi-name="java:/eis/AcmeAdminObject">
        <config-property name="Threshold">10</config-property>
     </admin-object>
 </admin-objects>
</resource-adapter>
The remote EJB request flow
In the second example, we will cover a slightly different approach which involves remote EJB calls. (Think for example of a remote EJB client).
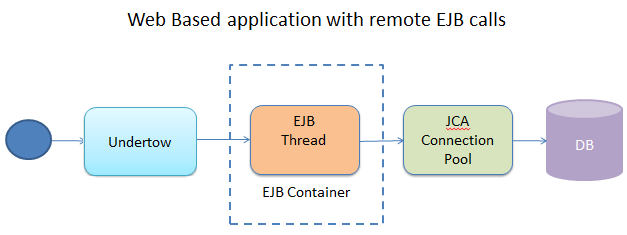
Since WildFly 8, these calls are not landing directly into the EJB Container, but they are mediated by Undertow which performs an Http upgrade towards the Remoting channel.
What is the main difference with the scenario that we have just covered ? As you can guess from the picture, the IO thread is not any more the driver of the call, but the EJB Thread pool comes into play. You can set the EJB thread pool from the ejb3 subsystem as follows:
/subsystem=ejb3/thread-pool=default/:write-attribute(name=max-threads,value=100)
In this example, we have set it to 100 which should be a fairly high value.
The Undertow threads still have some relevance in this scenario, as they will be used in case you are using async calls to your EJB and for providing the response to the client (Thanks to Stuart Douglas for pointing out this needful information). You can monitor the thread pool at runtime using the following CLI:
/subsystem=ejb3/thread-pool=default/:read-resource(include-runtime=true)
{
    "outcome" => "success",
    "result" => {
        "active-count" => 5,
        "completed-task-count" => 13L,
        "current-thread-count" => 3,
        "keepalive-time" => {
            "time" => 100L,
            "unit" => "MILLISECONDS"
        },
        "largest-thread-count" => 5,
        "max-threads" => 10,
        "name" => "default",
        "queue-size" => 0,
        "rejected-count" => 0,
        "task-count" => 0L,
        "thread-factory" => undefined
    }
}
Hungry for Tuning?

Speed-up your Enterprise Applications with our WildFly Performance Tuning guide!