In this quick article we will learn an handy option which is available in MySQL JDBC Driver to debug and profile SQL statements run by Java applications.
There are several strategies to trace SQL Statements that your application is running. For example, JPA applications typically use this option to show the actual SQL Statement that you are sending for execution:
<property name = "hibernate.show_sql" value = "true" />
While this option is valid across any RDMS, it does not provide a clue about the performance of SQL Statements. You would typically inquiry to your DBA to use custom views/functions to find, for example, which are the long running SQL Statement.
If you are using MySQL Database there’s a super simple way to do that. As you can see from the JDBC Driver documentation there are several parameters which can help to detect bottleneck in our Statements. One of the most useful ones is profileSQL. You can add it directly to your JDBC Connection String. Let’s see a practical example connecting WildFly to MySQL.
WildFly with MySQL Performance test
Firstly, let’s start MySQL Database. You can use docker for this purpose:
docker run --name mysql --rm -p 3306:3306 --name jboss-mysql -e MYSQL_ROOT_PASSWORD=admin -e MYSQL_DATABASE=sampledb -e MYSQL_USER=jboss -e MYSQL_PASSWORD=jboss mysql
Next, install the MySQL Datasource in a WildFly Server. You can use the CLI for this purpose:
module add --name=com.mysql   --dependencies=javax.api,javax.transaction.api --resources=mysql-connector-java-8.0.25.jar

/subsystem=datasources/jdbc-driver=mysql/:add(driver-module-name=com.mysql,driver-name=mysql,driver-class-name=com.mysql.jdbc.Driver)

data-source add --jndi-name=java:/MySqlDS --name=MySqlPool --connection-url=jdbc:mysql://localhost:3306/sampledb?profileSQL=true --driver-name=mysql --user-name=jboss --password=jboss
We assumed that the JDBC Driver mysql-connector-java-8.0.25.jar is available in the same location where you have started WildFLy CLI.
It’s time to test it! Install an application which uses the above Datasource. Example persistence.xml:
<persistence version="2.1"
             xmlns="http://xmlns.jcp.org/xml/ns/persistence" xmlns:xsi="http://www.w3.org/2001/XMLSchema-instance"
             xsi:schemaLocation="
        http://xmlns.jcp.org/xml/ns/persistence
        http://xmlns.jcp.org/xml/ns/persistence/persistence_2_1.xsd">
    <persistence-unit name="primary">
        <!-- If you are running in a production environment, add a managed
           data source, this example data source is just for development and testing! -->
        <!-- The datasource is deployed as WEB-INF/kitchensink-quickstart-ds.xml, you
           can find it in the source at src/main/webapp/WEB-INF/kitchensink-quickstart-ds.xml -->
        <jta-data-source>java:/MySqlDS</jta-data-source>
        <properties>
            <!-- Properties for Hibernate -->
            <property name="hibernate.hbm2ddl.auto" value="create-drop" />
            <property name="hibernate.show_sql" value="false" />
        </properties>
    </persistence-unit>
</persistence>
Next, issue any CRUD Operation against the Database. As you can see from the application server log, there’s a message in the Standard Output which contains the “duration” in ms of each Statement:
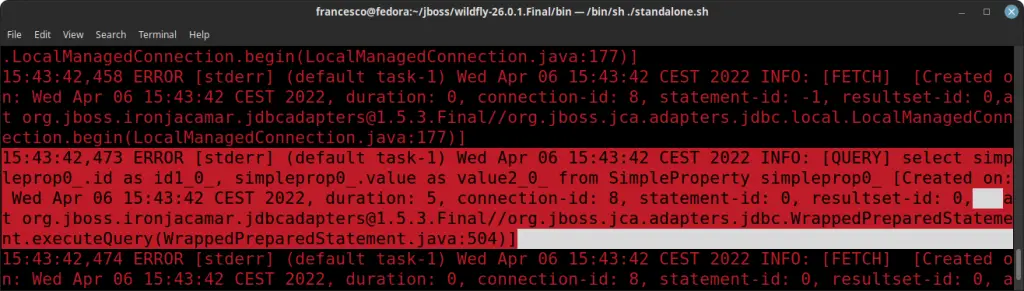
The log also contains details if there is in progress a FETCH or SELECT command. The log is emitted using the ERROR level, although there are no Exceptions or errors.
In DB terms, a FETCH means to get one row at a time from the result set of a query. That can later be used for processing the data and do some operations based on the data. The SELECT keyword, as the name suggests, selects data from the Table(s) based on conditions.
Other useful tuning options
The parameter profileSQL is often all you need to tune your application. Nevertheless there are other options which you can use for most exigent use cases:
- gatherPerfMetrics: Should the driver gather performance metrics, and report them via the configured logger every ‘reportMetricsIntervalMillis’ milliseconds?
- reportMetricsIntervalMillis: The interval (in ms) when gathering performance metrics..
- logSlowQueries: if true, logs queries that take longer than ‘slowQueryThresholdMillis’.
- slowQueryThresholdMillis: The interval (in ms) when logging slow queries.
- explainSlowQueries: If ‘logSlowQueries’ is enabled, should the driver automatically issue an ‘EXPLAIN’ on the server
Recommended reading: If you want to learn more about tracing SQL Statements on WildFly, check this article: How to trace JDBC statements with JBoss and WildFly