The HTTP Session size in cluster is a key metric to determine how much an application can scale. In this updated tutorial we will learn how to monitor and calculate the current HTTP Session size and the number of HTTP active sessions.
The first thing we need to check is the number of active HTTP Sessions. This is our first factor to consider. A simple way to count the active HTTP Sessions is to check the /deployment path to get the active-sessions number:
/deployment=session-size.war/subsystem=undertow:read-resource(include-runtime=true)
{
    "outcome" => "success",
    "result" => {
        "active-sessions" => 1,
        "context-root" => "/session-size",
        "expired-sessions" => 0,
        "highest-session-count" => -1,
        "max-active-sessions" => -1,
        "rejected-sessions" => 0,
        "server" => "default-server",
        "session-avg-alive-time" => 0,
        "session-max-alive-time" => 0,
        "sessions-created" => 1,
        "virtual-host" => "default-host",
        "servlet" => {
            "hello" => undefined,
            "com.mastertheboss.servlet.ServletReader" => undefined
        },
        "websocket" => undefined
    }
}
As you can check from the above output, there’s currently one active HTTP Session. There are some more options to check the number of active sessions: this article discusses them How to monitor and invalidate HTTP Sessions in WildFly
Then, we will check the size of the HTTP Session size using various methods.
Checking HTTP Session size through an Heap Dump
The most common way to check the size of objects retained in Memory is through an Heap Dump. HTTP Session makes no exception. Here is a Profiler Session which is digging into a Clustered Web cache:
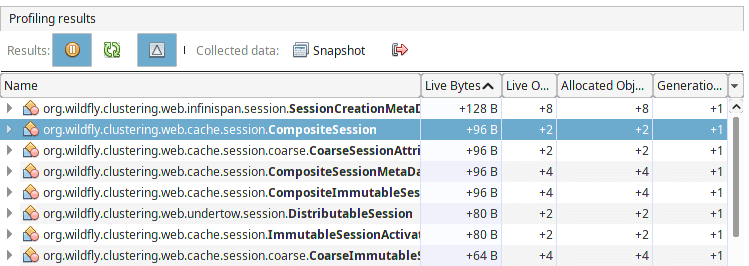
Advantages: there are many tools which let you capture an Heap Dump. The above is a screenshot from VisualVM. However, you can use Command Line tools like jmap for the same purpose. Besides it, an Heap Dump is the starting point for any Memory Leak analysis.
Disadvantages: Checking the HTTP Session size in an Heap dump can be complicated. As a matter of fact, the classes wrapping the HTTP Session can differ from one version of the Application Server to another. In the most recent version of WildFly, you should scan the packages “org.wildfly.clustering,web.cache.session” where you will find references to the HTTP Sessions created. To simplify your analysis, it is worth to use a tool which shows the delta between Heap Dumps so, for example, you can check the increase in Session size between two Heap Dumps.
Add the SIZE Protocol to your JGroups configuration
JGroups includes the SIZE protocol which prints out the actual size of a message which is replicated/distributed in a cluster. You need to add the SIZE protocol at the end of the JGroups stack (TCP or UDP) you are using. For example:
<stack name="udp">
    <transport type="UDP" socket-binding="jgroups-udp"/>
    <protocol type="PING"/>
    <protocol type="MERGE3"/>
    <socket-protocol type="FD_SOCK" socket-binding="jgroups-udp-fd"/>
    <protocol type="FD_ALL"/>
    <protocol type="VERIFY_SUSPECT"/>
    <protocol type="pbcast.NAKACK2"/>
    <protocol type="UNICAST3"/>
    <protocol type="pbcast.STABLE"/>
    <protocol type="pbcast.GMS"/>
    <protocol type="UFC"/>
    <protocol type="MFC"/>
    <protocol type="FRAG3"/>
    <protocol type="SIZE"/>
</stack>
When the SIZE protocol is in the stack, a TRACE message will be emitted:
2021-09-20 10:48:34,383 TRACE [org.jgroups.protocols.SIZE] (default task-1) master:server-one.down(): size of message buffer=679b, 2 headers
The above message shows the size of the cluster message which includes (in its body) the HTTP Session. To show the above message in your server logs, you need to include as well a logger for org.jgroups.protocols.SIZE:
<logger category="org.jgroups.protocols.SIZE">
      <level name="TRACE"/>
</logger>
Advantages: This approach requires the least amount of work and it can simply added to your profile when needed and removed when you are done.
Disadvantages: The size of the message also includes the Header of the packet so you have to subtract some bytes to have the exact HTTP Session Size. For large HTTP Session objects, however, you can neglect this small difference. Also, for performance reasons, it is discouraged to TRACE the SIZE protocol in production.
Add a Filter to your Requests
Finally, the last approach you can use is to add a WebFilter which scans the HTTP Session each time an HTTP Request is received. Here is our Filter class:
@WebFilter("/*")

public class FilterSession implements Filter {

    public void init(FilterConfig filterConfig) throws ServletException { }

    public void doFilter(ServletRequest request,
                         ServletResponse response,
                         FilterChain chain)
        throws IOException, ServletException {
        chain.doFilter(request, response);
        HttpSession session = ((HttpServletRequest)request).getSession(false);
        if (session == null) {
            return;
        }
        String id = session.getId();
        int size = 0;
        ByteArrayOutputStream baos = new ByteArrayOutputStream();
        ObjectOutputStream oos = new ObjectOutputStream(baos);
        try {
            //int previous = 0; // for debug log
            for (Enumeration e = session.getAttributeNames();
                 e.hasMoreElements(); ) {
                String key = (String)e.nextElement();
                try {
                    oos.writeObject(session.getAttribute(key));
                    oos.flush();

                } catch (NotSerializableException exc) {
                	exc.printStackTrace();
                }
            }
            oos.flush();
            size = baos.toByteArray().length;
        } finally {
            try {
                oos.close();
            } catch (Exception ignore) { }
        }
        System.out.println("HTTP Session: id:"+id+ " Size "+size);
    }

    public void destroy() { }

}
As you can see, the logic is pretty straightforward: for every request, we iterate over the Session Elements. For each key, we write the value in a ByteArrayOutputStream. Then, we convert the Stream to an Array of bytes so that we can calculate its size.
Advantages: This is the most precise method to calculate the size of the HTTP Session. Also, it is application-server neutral so you can apply it to any application server which supports Servlet Filters.
Disadvantages: You need to pack the Class in the archive you want to monitor. Therefore, it requires a rebuild (or repackage) of your archive.
Conclusion
By regularly measuring and analyzing the size, administrators can gain valuable insights into resource utilization, optimize performance, and ensure efficient session replication. Understanding the session replication size empowers administrators to make informed decisions and proactively address any potential issues, ultimately enhancing the overall reliability and scalability of their clustered environment.