This tutorial will give you an headstart about developing Enterprise applications with IntelliJ IDEA and WildFly. We will cover how to manage the integration with the application server and how to debug applications.
Developing applications with IntelliJ Idea and WildFly is a popular choice for many Java developers. IntelliJ Idea is a powerful integrated development environment (IDE) that provides advanced code editing, debugging, and testing capabilities, while WildFly is a lightweight and flexible application server that supports the latest Jakarta EE standards.
WildFly and IntelliJ Integration
The integration with WildFly requires the Ultimate version of IntelliJ Idea.
You can find it in: Settings > Build, Executions, Deployment -> Application Servers > “+” > JBoss Server.
Then, you will be able to add a Run/ Debug configuration which includes JBoss Server.

If you want to use the Community Edition of IntelliJ IDEA it is however fairly easy to manage WildFly without leaving IntelliJ Idea. For this purpose, you can use the following plugins in your Maven projects:
WildFly Maven plugin: This plugin covers every aspect of WildFly. You can use it to deploy applications, to live reload them after changes. You can also use it to execute management commands from your pom.xml. Read more about it here: How to configure and run Maven WildFly plugin
WIldFly Bootable Jar plugin: This plugins allows to bundle the application server along with your application as a bootable artifact. Therefore, you can simply start and stop WildFly as you run your application. Read more about it here: Turn your WildFly application in a Bootable JAR
Debugging remotely WildFly with IntelliJ Idea
If you don’t have the Ultimate edition of IntelliJ Idea available, you can still start WildFly as a separate process and debug your applications in IntelliJ. You can however debug your WildFly applications with IntelliJ Idea pretty easily.
Remote debugging is a key feature that is necessary to track issues on your server side applications. In order to activate remote debugging on the application server, a set of JVM arguments needs to be enabled at application server startup. You can enable them in the file standalone.conf which is located in the bin folder of the application server:
# Sample JPDA settings for remote socket debugging
JAVA_OPTS="$JAVA_OPTS -agentlib:jdwp=transport=dt_socket,address=8787,server=y,suspend=n"n
Next, set up one or more break-points into any of your server side classes. Now you can start the application server as usual with:
./standalone.sh
You will notice that the server log contains the following line, just at the beginning of it:
Listening for transport dt_socket at address: 8787
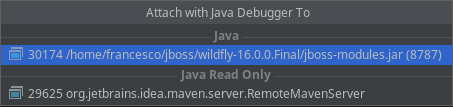
Next, you need to attach your IDE the Remote Socket started by WildFly on Port 8787. The simplest way to do that is to select Run | Attach to Process. The runnable process of WildFly will be detected, as you can see from the following snapshot:
Now, if you try to access to the source code which contains a breakpoint, the execution will stop and you will be able to manage the standard debugging flow fro the Debugger panel:

After the program has been suspended, you can use the debugger to get the information about the state of the program and how it changes during running.
The debugger provides you with the information about variable values, objects breakdown, the current state of the threads, and so on. It also allows you to test your program in various conditions by throwing exceptions or running arbitrary code right in the middle of the program execution.
While these tools let you examine the program state at a particular instant, the stepping feature gives you the control over step-by-step execution of the program. By combining the tools you can deduce where the bug is coming from and test your program for robustness.