Do you need to include cool charts in your Web application and you want to do it really quickly? Have a look at Primefaces which features a large set of to chart components to render your data.
Set up your Primefaces project
Firstly, to kickstart your Primefaces application include the following dependencies in your project’s pom.xml:
<dependencies>
    <dependency>
        <groupId>jakarta.platform</groupId>
        <artifactId>jakarta.jakartaee-api</artifactId>
        <version>8.0.0</version>
        <scope>provided</scope>
    </dependency>

    <dependency>
        <groupId>org.primefaces</groupId>
        <artifactId>primefaces</artifactId>
        <version>10.0.0</version>
    </dependency>
</dependencies>
With that in place, we are ready to add your first Primefaces Chart.
Create a Primefaces Line Chart
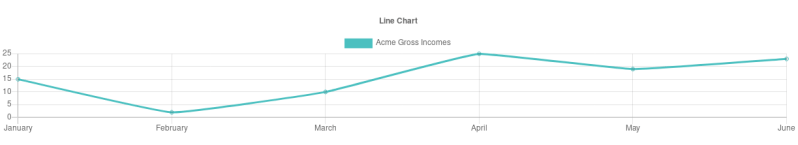
Our first example includes a Line Chart. The Client side API to display a Line Chart is pretty simple:
<p:lineChart model="#{lineChart.lineModel}" style="width: 50%; height: 50%;"/>
The element lineChart maps a Managed Bean which contains the graph data in the LineChart Bean and the lineModel field. Here is the LineChart Bean:
package com.mastertheboss.model;

import java.util.ArrayList;
import java.util.List;
import javax.annotation.PostConstruct;
import javax.enterprise.inject.Model;

import org.primefaces.model.charts.*;
import org.primefaces.model.charts.line.*;
import org.primefaces.model.charts.optionconfig.title.Title;

@Model
public class LineChart {
    private LineChartModel lineModel;

    @PostConstruct
    public void init() {
        lineModel = new LineChartModel();
        ChartData data = new ChartData();

        LineChartDataSet dataSet = new LineChartDataSet();
        List values = new ArrayList<>();
        values.add(15);
        values.add(2);
        values.add(10);
        values.add(25);
        values.add(19);
        values.add(23);

        dataSet.setData(values);
        dataSet.setFill(false);
        dataSet.setLabel("Acme Gross Incomes");
        dataSet.setBorderColor("rgb(75, 192, 192)");
        dataSet.setLineTension(0.1);
        data.addChartDataSet(dataSet);

        List<String> labels = new ArrayList<>();
        labels.add("January");
        labels.add("February");
        labels.add("March");
        labels.add("April");
        labels.add("May");
        labels.add("June");

        data.setLabels(labels);

        //Options
        LineChartOptions options = new LineChartOptions();
        Title title = new Title();
        title.setDisplay(true);
        title.setText("Line Chart");
        options.setTitle(title);

        lineModel.setOptions(options);
        lineModel.setData(data);
    }

    public LineChartModel getLineModel() {
        return lineModel;
    }
}
Deploy your application on the application server. In our case, we will target the application on WildFly application server using its Maven plugin:
$ mvn install wildfly:deploy
Here is your Primefaces graph in action:
Create a Primefaces Bar Chart
Our second example uses a Bar Chart to provide a way of showing data values represented as vertical bar. The Client API does not differ too much from the LineChart component:
<p:barChart model="#{barChart.barModel}" style="width: 50%; height: 50%;"/>
The Model is contained in the BarChart Bean which follows here:
package com.mastertheboss.model;

import java.util.ArrayList;
import java.util.List;

import javax.annotation.PostConstruct;
import javax.enterprise.inject.Model;

import org.primefaces.model.charts.*;
import org.primefaces.model.charts.axes.cartesian.CartesianScales;
import org.primefaces.model.charts.axes.cartesian.linear.CartesianLinearAxes;
import org.primefaces.model.charts.axes.cartesian.linear.CartesianLinearTicks;
import org.primefaces.model.charts.bar.*;
import org.primefaces.model.charts.optionconfig.legend.Legend;
import org.primefaces.model.charts.optionconfig.legend.LegendLabel;
import org.primefaces.model.charts.optionconfig.title.Title;

@Model
public class BarChart {
    private BarChartModel barModel;

    @PostConstruct
    public void init() {
        barModel = new BarChartModel();
        ChartData data = new ChartData();

        BarChartDataSet barDataSet = new BarChartDataSet();
        barDataSet.setLabel("Acme Gross Incomes");

        List<Number> values = new ArrayList<>();
        values.add(65);
        values.add(59);
        values.add(80);
        values.add(81);
        values.add(56);
        values.add(55);
        values.add(40);
        barDataSet.setData(values);

        List<String> labels = new ArrayList<>();
        labels.add("January");
        labels.add("February");
        labels.add("March");
        labels.add("April");
        labels.add("May");
        labels.add("June");
        labels.add("July");
        data.setLabels(labels);

        //Data
        barModel.setData(data);

        //Options
        BarChartOptions options = new BarChartOptions();
        CartesianScales cScales = new CartesianScales();
        CartesianLinearAxes linearAxes = new CartesianLinearAxes();
        CartesianLinearTicks ticks = new CartesianLinearTicks();
        ticks.setBeginAtZero(true);
        linearAxes.setTicks(ticks);
        cScales.addYAxesData(linearAxes);
        options.setScales(cScales);

        Title title = new Title();
        title.setDisplay(true);
        title.setText("Bar Chart");
        options.setTitle(title);

        Legend legend = new Legend();
        legend.setDisplay(true);
        legend.setPosition("top");
        LegendLabel legendLabels = new LegendLabel();
        legendLabels.setFontStyle("bold");
        legendLabels.setFontColor("#2980B9");
        legendLabels.setFontSize(24);
        legend.setLabels(legendLabels);
        options.setLegend(legend);

        barModel.setOptions(options);
    }

    public BarChartModel getBarModel() {
        return barModel;
    }
}
If you want to have different colors for your single bars, you can add to your ChartData instance the RGB colors for each entry:
List<String> bgColor = new ArrayList<>();
bgColor.add("rgba(255, 99, 132, 0.2)");
bgColor.add("rgba(255, 159, 64, 0.2)");
bgColor.add("rgba(255, 205, 86, 0.2)");
bgColor.add("rgba(75, 192, 192, 0.2)");
bgColor.add("rgba(54, 162, 235, 0.2)");
bgColor.add("rgba(153, 102, 255, 0.2)");
bgColor.add("rgba(201, 203, 207, 0.2)");
barDataSet.setBackgroundColor(bgColor);

List<String> borderColor = new ArrayList<>();
borderColor.add("rgb(255, 99, 132)");
borderColor.add("rgb(255, 159, 64)");
borderColor.add("rgb(255, 205, 86)");
borderColor.add("rgb(75, 192, 192)");
borderColor.add("rgb(54, 162, 235)");
borderColor.add("rgb(153, 102, 255)");
borderColor.add("rgb(201, 203, 207)");
barDataSet.setBorderColor(borderColor);
barDataSet.setBorderWidth(1);

data.addChartDataSet(barDataSet);
Deploy your application again and check the result:

Using an Horizontal Bar Chart
If you want to switch to an Horizontal Chart for your bars, all you need is to replace the BarChartModel with an HorizontalBarChartModel and a BarChartDataSet with an HorizontalBarChartDataSet:
    private HorizontalBarChartModel hbarModel;

    @PostConstruct
    public void init() {
        hbarModel = new HorizontalBarChartModel();
        ChartData data = new ChartData();

        HorizontalBarChartDataSet hbarDataSet = new HorizontalBarChartDataSet();
Other Primefaces Graphs
As you can see from Primefaces show case, there are several other charts available out of the box. We will mention a few options taken from the showcase:
Pie Chart
Include in your HTML page:
<p:pieChart model="#{chartJsView.pieModel}" style="width: 100%; height: 500px;"/>
In your Bean:
    private void createPieModel() {
        pieModel = new PieChartModel();
        ChartData data = new ChartData();

        PieChartDataSet dataSet = new PieChartDataSet();
        List<Number> values = new ArrayList<>();
        values.add(300);
        values.add(50);
        values.add(100);
        dataSet.setData(values);

        List<String> bgColors = new ArrayList<>();
        bgColors.add("rgb(255, 99, 132)");
        bgColors.add("rgb(54, 162, 235)");
        bgColors.add("rgb(255, 205, 86)");
        dataSet.setBackgroundColor(bgColors);

        data.addChartDataSet(dataSet);
        List<String> labels = new ArrayList<>();
        labels.add("Red");
        labels.add("Blue");
        labels.add("Yellow");
        data.setLabels(labels);

        pieModel.setData(data);
    }
Bubble Chart
In your HTML page:
<p:bubbleChart model="#{chartJsView.bubbleModel}" style="width: 100%; height: 500px;"/>
In your Managed Bean:
    public void createBubbleModel() {
        bubbleModel = new BubbleChartModel();
        ChartData data = new ChartData();

        BubbleChartDataSet dataSet = new BubbleChartDataSet();
        List<BubblePoint> values = new ArrayList<>();
        values.add(new BubblePoint(20, 30, 15));
        values.add(new BubblePoint(40, 10, 10));
        dataSet.setData(values);
        dataSet.setBackgroundColor("rgb(255, 99, 132)");
        dataSet.setLabel("First Dataset");
        data.addChartDataSet(dataSet);
        bubbleModel.setData(data);
    }
Donut Chart
In your HTML Page:
<p:donutChart model="#{chartJsView.donutModel}" style="width: 100%; height: 500px;"/>
In your Managed Bean:
public void createDonutModel() {
    donutModel = new DonutChartModel();
    ChartData data = new ChartData();

    DonutChartDataSet dataSet = new DonutChartDataSet();
    List<Number> values = new ArrayList<>();
    values.add(300);
    values.add(50);
    values.add(100);
    dataSet.setData(values);

    List<String> bgColors = new ArrayList<>();
    bgColors.add("rgb(255, 99, 132)");
    bgColors.add("rgb(54, 162, 235)");
    bgColors.add("rgb(255, 205, 86)");
    dataSet.setBackgroundColor(bgColors);

    data.addChartDataSet(dataSet);
    List<String> labels = new ArrayList<>();
    labels.add("Red");
    labels.add("Blue");
    labels.add("Yellow");
    data.setLabels(labels);

    donutModel.setData(data);
}
Conclusion
We have discussed how to create a different set of Primefaces chart to be used in a Web application. To test our application we have used as target server WildFly application server.
The source code for this tutorial is available here: https://github.com/fmarchioni/mastertheboss/tree/master/web/primefaces/chart