Quarkus now includes (since version 2.3.0) a Development UI (DevUI) which allows us to monitor runtime information about your extensions.
Quarkus DevUI is an experimental feature you can use to collect inner details of your Quarkus environment. You can use for different purposes such as:
- Application introspection, to see the list of Beans / Observers / Interceptors / Events built in your runtime
- To gather extension specific information: for example you can monitor the performance of single REST Endpoints
- To modify at runtime Quarkus configuration
On the top of that, you can also extend the DevUI, adding custom actions to existing extensions or to your own extensions.
To see the DevUI in action, we recommend starting one of the available quickstarts, for example Hibernate ORM quickstart.
Connecting to Quarkus Dev UI Console
Quarkus Dev Ui is available when running in Development mode. Therefore, start your application as follows:
mvn quarkus:dev
In order to connect to Quarkus Dev UI Console, navigate to the endpoint http://localhost:8080/q/dev/
There, you will see a grid-layout which includes all the extensions available in your application:
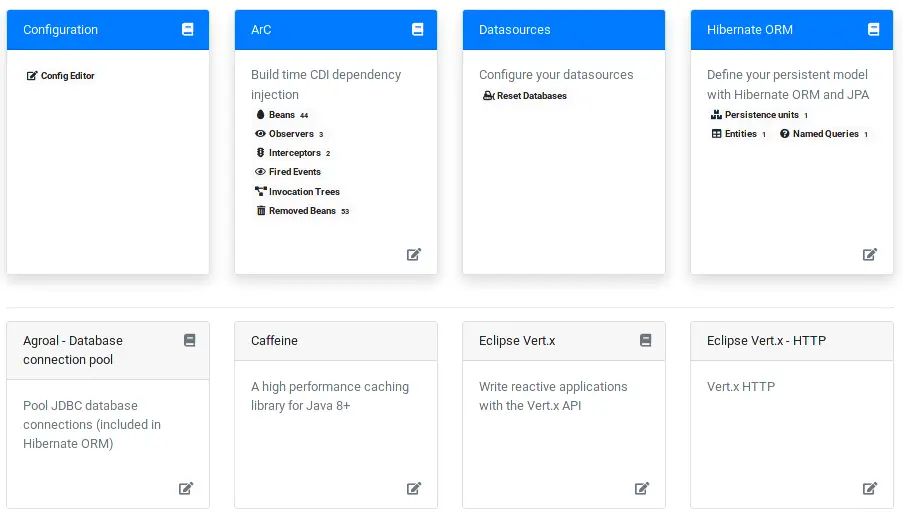
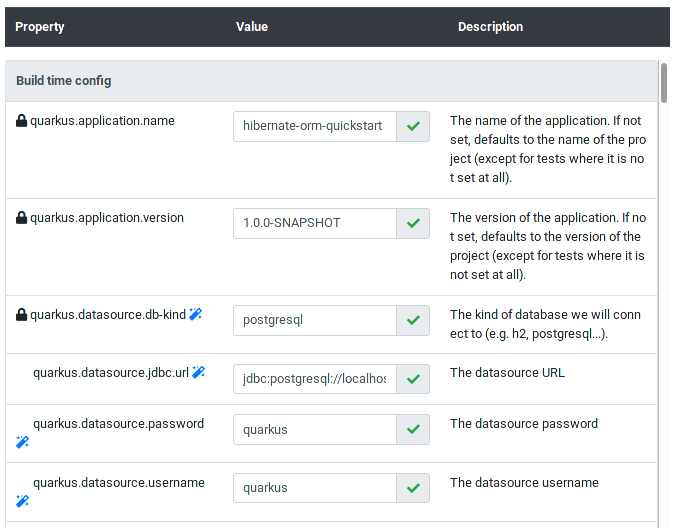
For space reasons. we are showing just the top rows. Within the Configuration section, you will be able to edit at runtime your Configuration as shown in the following picture:
The ArC window shows details about Quarkus DI such as loaded Beans, Observers, Interceptors, Fired Events, Invocation Trees and Removed Beans.
Within this box, if you look at the invocation tree, you can get runtime statistics about your Bean invocations:

What I find particularly useful is that each extension can have custom actions and has shortcut to internal details. So, for example, if you are running Qute templates in your application, you can render a preview of your templates from the Web UI.
Another example, if you are running RESTEasy Reactive endpoints, then you will be able to see the REST scores console, which shows the behavior of four REST reactive endpoints with scores and colors:
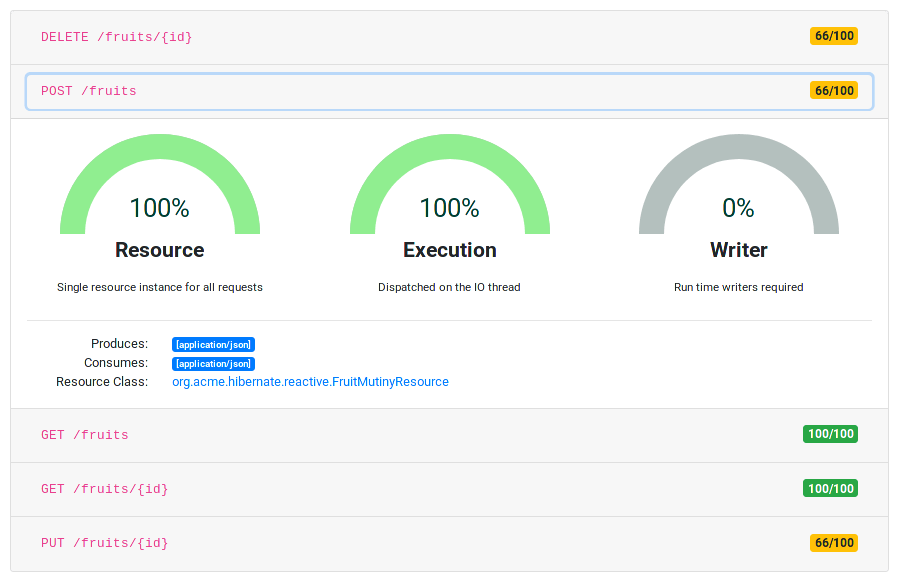
For each REST Endpoint, you will be able to measure the Resource, Execution and Writer performance. The above example, shows that the fruits POST endpoint is optimized for resource and Execution. In contrast, the Writer measurements can be further optimized.
Conclusion
Quarkus Dev UI is an intuitive tool to capture runtime information and configuration from a single UI. Within the project documentation, you will find advanced usage options for this tool.