Openshift metrics is an essential component to gather information about the health of your Paas. In this tutorial we will learn how to start Openshift Origin with metrics enabled and how you can check them.
Openshift Metrics is a component designed to gather container, pod and node metrics from across an entire OpenShift cluster. These metrics can then be viewed in the OpenShift Console or exported to another system through the REST API.
Components of Openshift Metrics
- Heapster gathers the metrics from across the OpenShift cluster. It retrieves metadata associated with the cluster from the master API and retrieves individual metrics from the /stats endpoint which is exposed on each individual OpenShift node. It gathers system level metrics such as CPU, Memory, Network, etc. Heapster will then send these metrics to Hawkular Metrics and expose a REST endpoint that the horizontal pod autoscaler (HPA) uses.
- Hawkular Metrics: is the metric storage engine from the Hawkular project. It provides means of creating, accessing and managing historically stored metrics via an easy to use json based REST interface. Hawkular Metrics uses Cassandra as its metric datastore.
- Cassandra: is the data store for Hawkular Metrics. It stores and persists all the metrics coming in from Hawkular Metrics.
There is another component named Hawkular OpenShift Agent which can be used to gather application level metrics coming from pods. This allows pods themselves to expose metrics that they wish to be collected. This component runs as a deamon set across the OpenShift cluster and is responsible for gathering application level metrics from each pod running on that node. We will discuss about Hawkular OpenShift Agent in another tutorial.
Starting Openshift Origin with Metrics
Starting Openshift Origin with metrics enabled couldn’t be simpler! all you need to do is including the “–metrics” option at cluster start up:
$ oc cluster up --version=latest --metrics
-- Checking OpenShift client ... OK
-- Checking Docker client ... OK
-- Checking Docker version ... OK
-- Checking for existing OpenShift container ... OK
-- Checking for registry.access.redhat.com/openshift3/ose:latest image ... OK
-- Checking Docker daemon configuration ... OK
-- Checking for available ports ...
-- Checking type of volume mount ...
   Using nsenter mounter for OpenShift volumes
-- Creating host directories ... OK
-- Finding server IP ...
   Using 192.168.1.194 as the server IP
-- Starting OpenShift container ...
   Creating initial OpenShift configuration
   Starting OpenShift using container 'origin'
   Waiting for API server to start listening
   OpenShift server started
-- Adding default OAuthClient redirect URIs ... OK
-- Installing registry ... OK
-- Installing router ... OK
-- Installing metrics ... OK
-- Importing image streams ... OK
-- Importing templates ... OK
-- Login to server ... OK
-- Creating initial project "myproject" ... OK
-- Removing temporary directory ... OK
-- Server Information ...
   OpenShift server started.
   The server is accessible via web console at:
       https://192.168.1.194:8443

   The metrics service is available at:
       https://metrics-openshift-infra.192.168.1.194.xip.io
As you can see we have been informed that the metrics have been installed and are available as a service.
Now let’s check what is the status of metric pods. As these pods are running in the openshift-infra project, we have to login as administrator first:
oc login -u system:admin
Metrics will take a while to be started, however you will be able to see from the pod list that the tree core components are Running:
oc get pods -n openshift-infra
NAME                         READY     STATUS    RESTARTS   AGE
hawkular-cassandra-1-05wkv   1/1       Running   0          25m
hawkular-metrics-y9hx3       1/1       Running   0          25m
heapster-5d65p               1/1       Running   0          25m
metrics-deployer-pod         0/1       Error     0          26m
By the way, the metrics-deployer-pod is a component which has been deprecated. In our case it has failed to load the image, though it will not be an issue for us.
Have a check that the hawcular metric pod successfully started:
$ oc logs -f hawkular-metrics-y9hx3
2017-06-28 13:58:42,071 INFO  [org.hawkular.metrics.core.dropwizard.MetricsInitializer] (metricsservice-lifecycle-thread) Creating metrics
2017-06-28 13:58:42,850 INFO  [org.hawkular.metrics.core.dropwizard.MetricsInitializer] (RxComputationScheduler-3) Finished creating metrics in 778 ms2017-06-28 13:58:42,850 INFO  [org.hawkular.metrics.core.dropwizard.MetricsInitializer] (RxComputationScheduler-3) Finished creating metrics in 778 ms
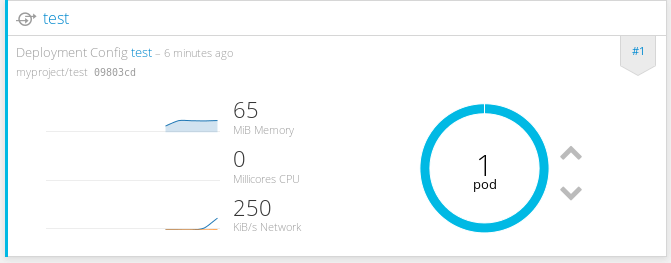
As you can see, by logging into the console with developer user, our application pod now are enriched with metrics:
More details about are available in the single Pods, which now have also the “Metrics” tab:
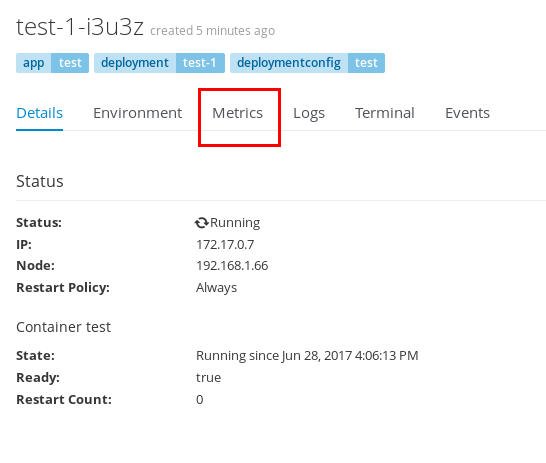
By selecting the “Metrics” tab, you will be able to see an historical graph of the core metrics related to that Pod:

As a side note, metrics are available also via REST API through the virtual route created by Openshift. For example, here’s how to gather cpu information for the pod test-1-i3u3z running into the project “myproject”:
$ curl -k -H "Hawkular-Tenant: myproject" -X GET https://metrics-openshift-infra.192.168.1.66.xip.io/hawkular/metrics?tags=descriptor_name:cpu/usage,pod_name:test-1-i3u3z  | python -m json.tool
  % Total    % Received % Xferd  Average Speed   Time    Time     Time  Current
                                 Dload  Upload   Total   Spent    Left  Speed
100  1600  100  1600    0     0   6109      0 --:--:-- --:--:-- --:--:--  6106
The REST API can in turn be collected and combined by other tools like ElasticSearch and exported to an UI dashboard tool like Kibana. But that will be discussed in another tutorial!