In this tutorial we will learn how to setup, configure and monitor a WildFly application server node using the AppDynamics Performance Management (APM) solution.
In order to get started with AppDynamics we will start a 15 days free trial subscription at https://portal.appdynamics.com/account/signup/signupForm/ Once expired the pro trail of AppDynamics you can still use the Lite version of it which is recommended for small environments, being limited to just 3 application agents (1 Java, 1 .NET, and 1 PHP) and 3 machine agents.
So once started the subscription we need to download the agent that will be installed on our Java applications, in our case we will install it on WildFly application server. You need to follow different guidelines depending if you are planning to monitor your application using:
- SaaS Controller: which means that you will be able to monitor your applications using a cloud dashboard
- On-Premise Controller: which means that you will install the Agent Controller in your environment and access locally your application statistics
In our case, we will choose to run a SaaS Controller which is a perfect choice for getting started with AppDynamics. So move to the AppDynamics Download zone and download the Java Agent which is fit for your environment. Now unzip the file to a location of your like, for example C:\appdynamics
Now we need to apply one change to WildFly (or JBoss) JAVA_OPTS so that you include the -javaagent parameter pointing to the location where javaagent.jar resides. Hence, open the appropriate startup-configuration file (standalone.conf.bat for Windows standalone application servers) and include the following JAVA_OPTS:
set "JAVA_OPTS=%JAVA_OPTS% -javaagent:C:\appdynamics\javaagent.jar -Djboss.modules.system.pkgs=org.jboss.byteman,com.appdynamics,com.singularity"
The “jboss.modules.system.pkgs” property tells JBoss Modules to allow the “com.singularity” classes to be found from any class loader, which is essential to allow the AppDynamics agent to run.
That’s all! now start the application server and start pumping some request on it. In order to monitor your data using the SaaS controller you will need to point to your cloud address, which is in our case https://mastertheboss.saas.appdynamics.com
From the AppDynamics Controller you will be able to enter a set of DashBoards. The first one we meet is the “All Applications Dashboard“
The All Applications dashboard shows high-level performance information about one or more business applications. Load, response time, and errors are standard metrics that AppDynamics calls “key performance indicators” or “KPIs”. The others are:
- Health Rule Violations and Policies: AppDynamics lets you define a health rule, which consists of a condition or a set of conditions based on metrics exceeding predefined thresholds or dynamic baselines. You can then use health rules in policies to automate optional remedial actions to take if the conditions trigger. AppDynamics also provides default health rules to help you get started.
- Business Transaction Health: The health indicators are a visual summary of the extent to which a business transaction is experiencing critical and warning health rule violations.
- Server Health: Additional visual indicators that track how well the server infrastructure is performing.

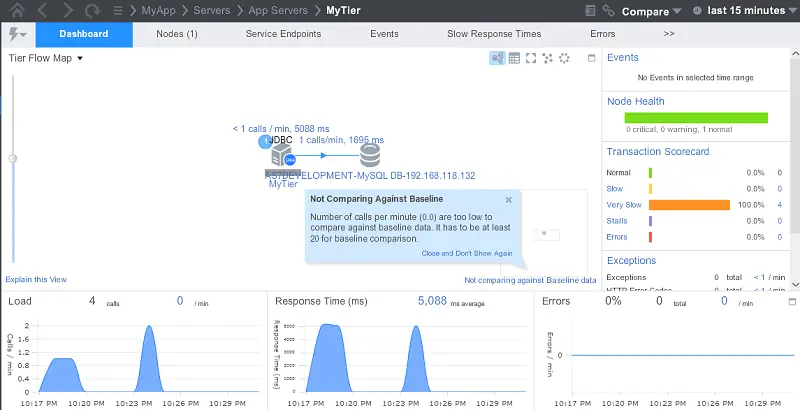
Now click an application to monitor: you will be redirected to the Application dashboard which gives you a view of how well the application is performing. The flow map on the left gives you an overview of your servers (application servers, databases, remote servers such as message queues, etc.) and metrics for the calls between them. Click, hold and move the icons around to arrange the flow map. Use the scale slider and mini-map to change the view.

As you can see, our Application Dashboard has automatically detected our environment which includes a Database (MySQL) that is accessed by JDBC.
The Transaction Scorecard panel shows metrics about business transactions within the specified time range, covering the percentage of instances that are normal slow, very slow, stalled or have errors. Slow and very slow transactions have completed. Stalled transactions never completed or timed out. Configurable thresholds define the level of performance for the slow, very slow and stalled categories.
In the lower part of the Dashboard you can have an immediate view of your server load, response time and Errors by means of intuitive gauges which automatically refresh, based on the time range. The TimeRange can be selected in the upper-right corner select the time range over which to monitor – the last 15 minutes, the last couple of hours, the last couple of days or weeks.
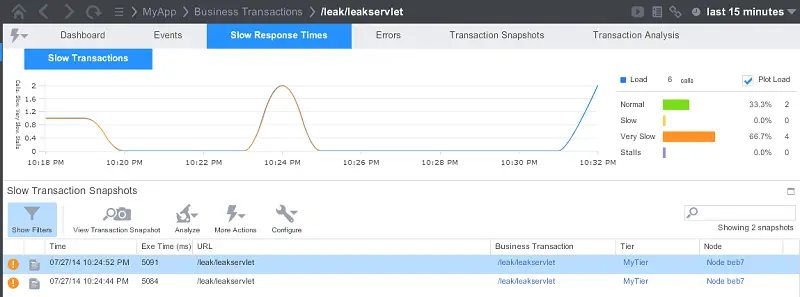
We will now investigate on the causes of our slow transactions, so just follow the “Very Slow” transactions link. You will be taken to the Slow Transaction snapshot:

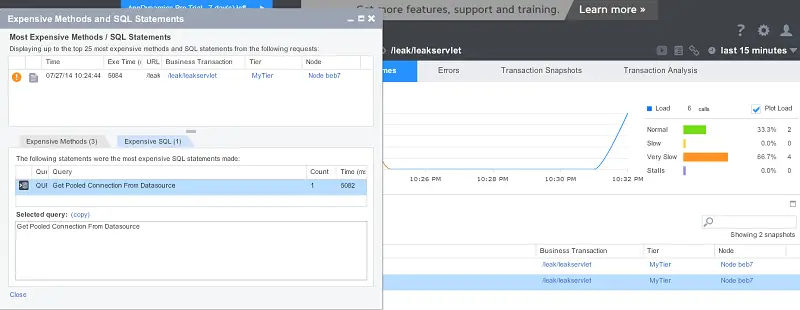
Within this Dashboard you can pinpoint the single transactions and further Analyze the cause of the slow transaction: in our case, our application is using an expensive SQL method to get a Pooled Connection from a DataSource: as a matter of fact, the database is on a remote machine which is connected to our application server using a poorly configured network:

As you can see, monitoring applications using AppDynamics is really simple and does not require a complex environment setup. Besides monitoring, AppDynamics values is also in the Actions, Rules and Policies which can be bound to your events. So for example, you can configure Polices to send alert, to perform diagnostics or execute scripts when an Health Rule is violated.
An Health Rule is based on the performance of Busines Transactions on your Nodes against their baseline or threshold. A Policy in turn uses Actions for the notifications such as sms notifications, mail notifications. You can also create Email Digest of your applications which are composed over a configurable period of time.
Found the article helpful? if so please follow us on Socials