Grafana is a web based framework which lets you create graphs and dashboards from data collected by several various monitoring systems. Grafana specializes in the display and analysis of this data with a lightweight, easy to install, beautiful web interface.
In this tutorial we have learnt how to persist some metrics of WildFly into InfluxDB: Using InfluxDB from a Java Enterprise application
Now, we will get back to the point were we left, with some Point objects stored in InfluxDB, reflecting the current free memory:
BatchPoints batchPoints = BatchPoints.database("java").tag("async", "true").retentionPolicy("autogen")
		.consistency(InfluxDB.ConsistencyLevel.ALL).tag("BatchTag", "BatchTagValue")
		.build();


long memory = Runtime.getRuntime().freeMemory();
Point point1 = Point.measurement("memory").time(System.currentTimeMillis(), TimeUnit.MILLISECONDS)
		.addField("free", memory).tag("MemoryTag", "MemoryTagValue")
		.build();
batchPoints.point(point1);

// Write them to InfluxDB
influxDB.write(batchPoints);
Installing Grafana
We can now move to Grafana installation, which can be done, on RHEL/Fedora machines as follows:
$ sudo yum install grafana
Once the installation completes, start the Grafana service:
$ sudo systemctl start grafana-server
You can check whether the Grafana service is running properly:
$ sudo systemctl status grafana-server
The following output will confirm that the service is running:
grafana-server.service - Starts and stops a single grafana instance on this system
   Loaded: loaded (/usr/lib/systemd/system/grafana-server.service; enabled; vendor preset: disabled)
   Active: active (running) since Mon 27 Feb 19:53:27 CET 2017
     Docs: http://docs.grafana.org
 Main PID: 16345 (grafana-server)
Let’s proceed with our tutorial. In order to create a Graph we need at first to define a Datasource which points to our Database.
Creating a Datasource
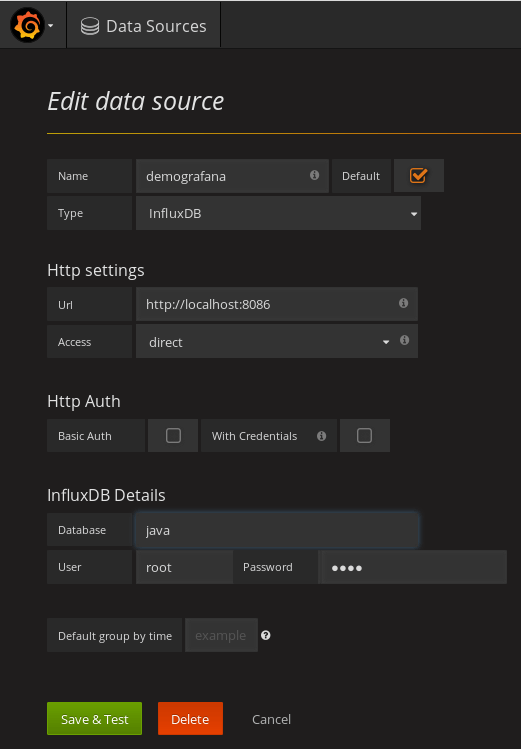
In order to create a Datasource, point to the Grafana Home page (default: http://localhost:3000) and click on Create your First Datasource option. In the following window, specify the Database endpoint(default http://localhost:8086), the Database type (InfluxDB) , the Database name (in our example “java”) and any authentication policy. When done, click on Save and Test as depicted by the following picture:
Creating a Dashboard
In order to display some Data, we need a Dashboard. Therefore click on “Create Dashboard”. Within a Dashboard you can define several panels such as:
- The Graph Panel: provides a very rich set of graphing options to display your data
- The Singlestat Panel: allows you to show the one main summary stat of a SINGLE series.
- The Table Panel: allows you to display collected data in various table formats
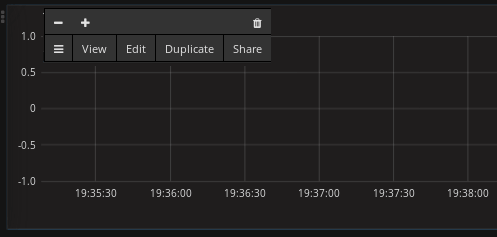
We will define a simple Graph, so click on the Graph icon.

An empty Graph will be created. You will have to define the related Datasource and its query by clicking at first on the “Edit option”:
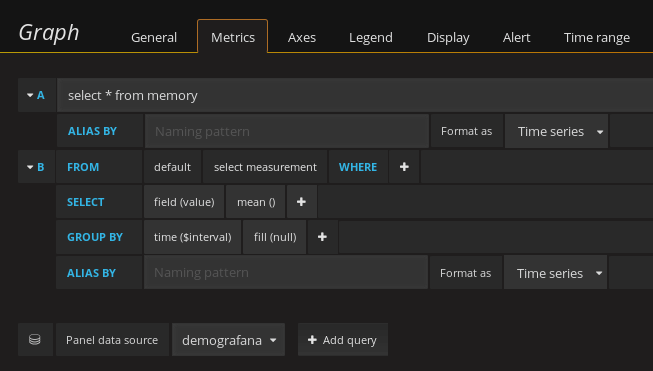
Now from within the edit option enter the “demografana” Datasource we have formerly defined and the Query we want to display on the Dashboard. Adjust the timing to display the collected data for a certain period:
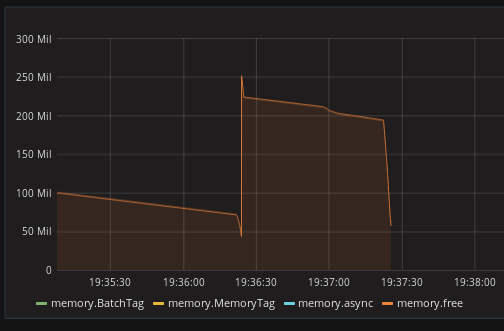
Once done, you will be able to display a Graph with the data that is available on InfluxDB. (You need to create some entries with your example application obviously):
Conclusion
In this tutorial, we have learned how to install and configure Grafana, and you created a dashboard connected to a Datasource that displayed data from InfluxDB. Each panel on a dashboard can display data from a different databases, and you can use Grafana to filter the data in many useful ways.