In this tutorial, we will explore JBoss Tattletale, a powerful tool for analyzing Java applications. JBoss Tattletale provides insights into your application’s dependencies, usage of deprecated APIs, class and package-level statistics, and much more. By identifying potential issues and providing in-depth reports, Tattletale helps you improve the quality and maintainability of your Java projects. Let’s dive in and learn how to utilize this tool effectively.
Prerequisites
To follow along with this tutorial, you need:
- Basic knowledge of Java development
- A Java Development Kit (JDK) installed
- A Java application or project to analyze
Step 1: Downloading and Installing JBoss Tattletale
- Visit the JBoss Tattletale GitHub repository: https://github.com/jboss-tattletale/tattletale.
- Download the latest release of Tattletale (a JAR file).
- Ensure that you have Java installed on your system.
- Place the downloaded JAR file in a suitable location.
Step 2: Running JBoss Tattletale
- Open a terminal or command prompt.
- Navigate to the directory where you placed the Tattletale JAR file.
- Execute the following command to run Tattletale:
java -jar tattletale.jar [OPTIONS] <path-to-your-application>
Replace
[OPTIONS]with any desired command-line options, and<path-to-your-application>with the path to your Java application or JAR file.
Step 3: Analyzing the Application with JBoss Tattletale
- Once Tattletale is running, it will analyze your application and generate various reports.
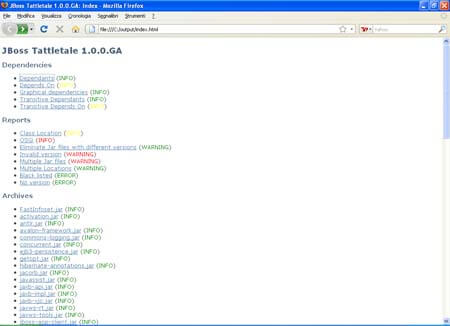
- Explore the generated reports to gain insights into different aspects of your application. Some useful reports include:
- Index: Provides an overview of the application’s structure, packages, classes, dependencies, and more.
- Depends on: Shows the dependencies between JAR files, highlighting potential issues such as conflicting or unused dependencies.
- Deprecated: Identifies the usage of deprecated classes and methods within your application.
- Statistics: Provides detailed statistics about classes, packages, and other metrics in your application.
- Clashes: Detects classes with the same fully qualified name but different implementations, which can lead to unexpected behavior.
- Packages: Gives an overview of the packages used in your application and their respective statistics.
- Analyze the reports and take note of any potential issues or areas for improvement in your application’s structure or dependencies.
Launch with your browser the output folder and explore the report:

The above section of the menu will display all class dependencies.
Select the link “Dependants”. This will display all’ required jar class by your application.
For example, supposing you need to reference log4j in your project, from the above menu you can see’ all required dependancies:

Step 4: Customizing Tattletale Analysis
Tattletale provides several command-line options to customize the analysis process. Here are a few notable options:
--output-directory <directory>: Specifies the directory where Tattletale should generate the reports. By default, it creates a directory namedtattletalein the current working directory.--skip <report-name>: Skips the generation of a specific report. Use the report name as specified in the Tattletale output.--fail-on <severity-level>: Sets the severity level at which Tattletale should fail and exit with a non-zero status. Valid severity levels areINFO,WARN, andERROR.--config <config-file>: Allows you to specify a custom configuration file for Tattletale, enabling advanced customization options.