This article discusses which are the best strategies to tune a Linux machine where you are running Java applications. We will first cover the best tools you can use for your analysis and then we will pinpoint the single OS aspects.
Collecting performance data
You can collect Performance data with different tools depending on the resource you are investigating:
| Resource | Tool |
| CPU | top, htop |
| Disk | iostat |
| Network | vnstat, iptraf-ng, netstat |
| Memory | free, vmstat |
In the following sections we will cover the areas where Java applications can typically benefit from a Linux System optimal configuration.
I/O tuning
A file system bottleneck usually follows a common pattern: you applications slows or hangs while at the same time the impact on CPU is small. By using the iostat tool you can verify if you have an high I/O rate. For example:
$ iostat
avg-cpu:  %user   %nice %system %iowait  %steal   %idle
           0.25    3.08    8.73    0.58    0.00   87.36
The %iowait column shows the percentage of the time that the CPU or CPUs were idle during which the system had an outstanding disk I/O request
If the %iowait% is constantly over 5%, then you have an IO bottleneck during that time window.
Before you can exclude that I/O is the cause of the issue, you also need to check your current Kernel file system settings. More in detail:
- file-max: determines the maximum number of file handles for the entire system. The default value is usually either 8192, or one tenth of the free memory pages available at the time the kernel starts. Raising this value can resolve errors caused by a lack of available file handles
- aio-max-nr: defines the maximum allowed number of events in all active asynchronous input/output contexts. The default value is 65536. Modifying this value does not pre-allocate or resize any kernel data structures. For example, in Artemis MQ Server the value of journal-max-io needs to be consistent with aio-max-nr
To increase the value for the above attributes, open the /etc/sysctl.conf and set:
# Increase size of file handles and inode cache
fs.file-max = 2097152
# Increase size async eventse
fs.aio-max-nr = 1048576
Is your Java Process Swapping?
Due to a lack of memory (RAM), the operating system could be swapping your application from memory. Swapping requires disk accesses, which is much slower compared to physical memory. In Java applications, swapping can potentially impact on the Garbage Collection which will result in a bad performance.
To check if your OS is swapping, you can check swap usage for your running processes:
#!/bin/bash
# Get current swap usage for all running processes
# Erik Ljungstrom 27/05/2011
# Modified by Mikko Rantalainen 2012-08-09
# Pipe the output to "sort -nk3" to get sorted output
# Modified by Marc Methot 2014-09-18
# removed the need for sudo

SUM=0
OVERALL=0
for DIR in `find /proc/ -maxdepth 1 -type d -regex "^/proc/[0-9]+"`
do
    PID=`echo $DIR | cut -d / -f 3`
    PROGNAME=`ps -p $PID -o comm --no-headers`
    for SWAP in `grep VmSwap $DIR/status 2>/dev/null | awk '{ print $2 }'`
    do
        let SUM=$SUM+$SWAP
    done
    if (( $SUM > 0 )); then
        echo "PID=$PID swapped $SUM KB ($PROGNAME)"
    fi
    let OVERALL=$OVERALL+$SUM
    SUM=0
done
echo "Overall swap used: $OVERALL KB"
Once you identify swap as bottleneck, you can tune the following parameters to do less swapping:
# Do less swapping
vm.swappiness = 10
vm.dirty_ratio = 60
vm.dirty_background_ratio = 2
Network
At the network level, many things can affect performance. The overall speed of a network connection is limited by the slowest link in the connection chain and the length of the chain. Identifying the slowest link is difficult though. Let’s check which are the most common culprits in a network performance problem:
Do you need to increase the backlog?
Simply put, the backlog is the maximum number of queued connections you want on a socket. This queue is there so you can handle a connection from a client while others wait in line. The backlog specifies how long you want this line to be. If more clients attempt to connect to your server, more than the backlog, those connections will be dropped.
If you have an insufficient value for the backlog (net.core.netdev_max_backlog ) you can expect packet loss. Before applying a fix you should observe the contents of /proc/net/softnet_stat whilst packet loss is occurring:
for i in {1..50}; do date; cat /proc/net/softnet_stat; sleep 1; done
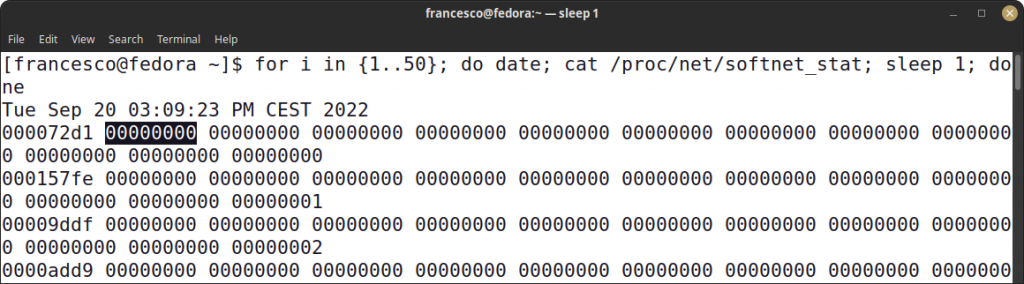
Check if the second column of softnet_stat is growing.
Then, check the current value of net.core.netdev_max_backlog with the command:.
sysctl net.core.netdev_max_backlog
net.core.netdev_max_backlog = 1000
Keep doubling this until the second column of softnet_stat does not grow at all, or at least not at a fast rate.
net.core.netdev_max_backlog = 2000
Another parameter which influences your backlog is somaxconn which defines the maximum number you’re allowed to pass to socket’s listen()
Setting net.core.somaxconn to higher values is a good option on highloaded servers where new connection rate is so high/bursty that having 128 not-yet-accepted connections is considered normal
# Increase number of incoming connections
net.core.somaxconn = 4096
Be careful! By increasing this parameter coud hide the real cause which is often either low processing rate (e.g. a single threaded blocking server) or insufficient number of worker threads/processes (e.g. multi- process/threaded blocking software like apache/tomcat)
Removing Dead connections
A large number of TCP connections can be a bottleneck for high load systems. You should aim at keeping the number of TCP connections in CLOSE_WAIT state low. Therefore, you will not hold dead connections to remote hosts. For example:
# Decrease the time default value for tcp_fin_timeout connection
net.ipv4.tcp_fin_timeout = 15

# Number of times SYNACKs for passive TCP connection.
net.ipv4.tcp_synack_retries = 2
Configuring KeepAlive timeout
KeepAlive is a mechanism intended for detect “Dead” connections due to peer gone conditions. From time to time, keep-alive sends a probe packet to each socket remote endpoint to see if some ACK response is sent back. If not, keep-alive marks the connection as “dead” and the operative system then is able to successfully “clean” the dead socket, freeing up space on the file table. Here’s how to tune keepalive to be a little more practical:
# tune TCP keepalive to be a little more practical
net.ipv4.tcp_keepalive_time = 300
net.ipv4.tcp_keepalive_probes = 5
net.ipv4.tcp_keepalive_intvl = 15
Adjusting Send/Receive Window Settings
In many environments packet loss may be caused by the buffer space not being large enough to receive all of the transmissions. This can also result in packet loss and costly retransmissions. A packet drop can mean your application is too busy to receive the packet or your network is congested.
For JBoss / WildFly users, the following hint shows that your send/receive buffers configuration is not optimal:
WARNING [org.jgroups.protocols.UDP] (ChannelService lifecycle - 1) send buffer of socket java.net.MulticastSocket@60c42064 was set to 640KB, but the OS only allocated 131.07KB. This might lead to performance problems. Please set your max send buffer in the OS correctly (e.g. net.core.wmem_max on Linux)

WARNING [org.jgroups.protocols.UDP] (ChannelService lifecycle - 1) receive buffer of socket java.net.MulticastSocket@60c42064 was set to 25MB, but the OS only allocated 131.07KB. This might lead to performance problems. Please set your max receive buffer in the OS correctly (e.g. net.core.rmem_max on Linux)
You can increase the kernel buffers by following the below steps:
Firstly, adjust Send and Receive Window Sizes. You need to operate in the /etc/sysctl.conf file as root. For example, the following line sets the receive window size to a value of 25 MB:
# Maximum Socket Receive Buffer
net.core.rmem_max = 12582912
Increase TCP Socket Sizes
The TCP send and receive socket sizes are also a tunable attribute. You can increase the TCP send socket size by adjusting the net.ipv4.tcp_wmem tuple. This tuple consists of three values, representing the minimum, default, and maximum values for the send buffer.
- min: below this number of pages, TCP does not care about its memory appetite.
- pressure: When the amount of memory that TCP/UDP uses exceeds this number of pages, the kernel will start to moderate its memory usage until it drops below min again.
- max: The maximum amount of memory allowed for queuing by all TCP/UDP sockets (in pages).
The recommendation is to use the maximum value of 16M bytes or higher especially for 10 Gigabit adapters.
net.ipv4.tcp_wmem = 4096 16384 655360
On the other hand, you can uncrease the TCP receive socket by adjusting the net.ipv4.tcp_rmem tuple. This tuple also contains a tuple of three values.To set it to the same size as the receive socket above we would add the following line to /etc/sysctl.conf:
net.ipv4.tcp_rmem = 4096 87380 26214400
Optionally, to load the new values into a running kernel (without a reboot), enter the following command as root:
sysctl -p
Setting buffer sizes at application level:
Finally, please note that you can also configure send/receive buffers in WildFly JGroups’ Protocol Stack. For example:
<stack name="udp">
    <transport type="UDP" socket-binding="jgroups-udp">
        <!-- Configure here for UDP send/receive buffers (in bytes) -->
        <property name="ucast_recv_buf_size">20000000</property>
        <property name="ucast_send_buf_size">640000</property>
        <property name="mcast_recv_buf_size">25000000</property>
        <property name="mcast_send_buf_size">640000</property>
    </transport>
    <protocol type="PING"/>
    <protocol type="MERGE2"/>
    <protocol type="FD_SOCK" socket-binding="jgroups-udp-fd"/>
    <protocol type="FD"/>
    <protocol type="VERIFY_SUSPECT"/>
    <protocol type="BARRIER"/>
    <protocol type="pbcast.NAKACK"/>
    <protocol type="UNICAST2"/>
    <protocol type="pbcast.STABLE"/>
    <protocol type="pbcast.GMS"/>
    <protocol type="UFC"/>
    <protocol type="MFC"/>
    <protocol type="FRAG2"/>
    <protocol type="RSVP"/>
</stack>
Check the memory of TCP/Kernel
Consider this scenario: Your application is becoming unresponsive. By executing the ‘dmesg’ command on the host prints this error message repeatedly:
[4486500.513856] TCP: out of memory -- consider tuning tcp_mem
[4487211.020449] TCP: out of memory -- consider tuning tcp_mem
Why an Out of Memory can happen at TCP stack ? the typical case is when your sockets options are trying to store extra structures. Common examples are:
- Applying strong crypto algorithms
- Applying a BPF filter program to a socket
- IPv6 Anycast
- Perform Remote Direct Memory Access (RDMA)
- MD5 protection of BGP sessions
In such cases, you should increase the value for net.core.optmem_max. For example:
# Increase the maximum amount of option memory buffers
net.core.optmem_max = 25165824
Jumbo Frames
By default the maximum transmission unit (MTU) is 1500 bytes. Jumbo frames should be enabled when the MTU is larger than the default, or when smaller messages are aggregated to be larger than 1500 bytes. By enabling Jumbo frames, more data is sent per ethernet frame. The MTU may be increased to a value up to 9000 bytes.
Important
For jumbo frames to be effective every intermediate network device between the sender and receiver must support the defined MTU size.
To enable jumbo frames add the following line to the configuration script of the network interface, such as /etc/sysconfig/network-scripts/ifcfg-eth0:
MTU=9000
Optimize Page memory
A memory page is a fixed size, continuous block of memory and is used when transferring data from one storage medium to another, and to allocate memory. In some architectures, larger sized pages are available for improved memory allocation. These pages are known as large (or huge) pages.
The default memory page size in most operating systems is 4 kilobytes (kb). For a 32-bit operating system the maximum amount of memory is 4 GB, which equates to 1,048,576 memory pages. A 64-bit operating system can address 18 Exabytes of memory (in theory), resulting in a very large number of memory pages. The overhead of managing such a large number of memory pages is significant, regardless of the operating system.
Large memory pages are pages of memory which are significantly larger than 4 kb (usually 2 Mb). Memory-intensive applications can benefit from the usage of Large Memory Pages. The goal Large Memory Page is to optimise processor Translation-Lookaside Buffers (TLB). TLB is a cache that holds the most-recently used virtual-to-physical address translations. TLB is a scarce system resource though. A TLB miss can be costly as the processor must then read from the hierarchical page table, which may require multiple memory accesses.
On the other hand, by using bigger page size, a single TLB entry can represent larger memory range. There will be less pressure on TLB and memory-intensive applications may have better performance.
To verify if your kernel supports Large Memory pages execute:
# cat /proc/meminfo | grep Huge
HugePages_Total: 0
HugePages_Free: 0
Hugepagesize: 2048 kB
If the output shows the three Huge settings then your kernel supports large page memory. If so, as next step, we will configure the system to use large page memory.
As a root, make sure the shmmax value is larger than the Java heap size. For example, on a machine with 4 GB of physical RAM (or less) the following will make all the memory sharable:
echo 4294967295 > /proc/sys/kernel/shmmax
Next, specify the number of large pages. For example:
echo 1536 > /proc/sys/vm/nr_hugepages
In the aboveexample 3 GB of a 4 GB system are reserved for large pages (with a large page size of 2048k, then 3 GB = 3145728k, and 3145728k / 2048k = 1536).
Tuning native memory with MALLOC_ARENA_MAX
MALLOC_ARENA_MAX is an environment variable to control how many memory pools can be created for glibc. Glibc, in turn, is the default native memory allocator of Java.
Applications using Java native memory (such as java.nio API) may tune application performance and memory use by adjusting the MALLOC_ARENA_MAX environment variable.
Java native memory is managed by the glibc library which uses multiple memory pools that malloc can allocate memory from. Especially for threaded programs, using multiple memory pools can speed up memory allocation (be reducing locking) and improve overall performance.
With some memory allocation patterns, this performance improvement can come at the cost of somewhat greater app memory consumption.
This may especially be the case for programs that create and destroy many threads and allocate lots of memory in those threads.
If your application has MALLOC_ARENA_MAX=2 set but has plenty of memory to spare, you may be able to see small gains in response time by increasing this value.
export MALLOC_ARENA_MAX=8
On the other hand, consider lowering MALLOC_ARENA_MAX to prevent native Out of Memory issues. To learn more about Java Native Out of Memory issues check this article: Troubleshooting OutOfMemoryError: Direct buffer memory