Slack is a channel-based messaging platform which can be used to help people to effectively work together, connect their software tools and services, and find the information they need within a secure, enterprise-grade environment. In this tutorial you will learn how to forward application alerts to a Slack channel so that your team can get this information in real time.
As we said, Slack is a channel based messaging platform that can essentially help you at:
- Organize conversations in your team to share ideas and make decisions.
- Share files and documents
- Find everything in your archive’s workspace
- Speak face-to-face with your colleagues right from inside Slack.
Getting started with Slack
Getting started with Slack involves a set of simple steps:
1) Navigate to this URL: https://api.slack.com/apps?new_app=1 and Login to your Slack account or create a new Slack account
Slack is also available as desktop and mobile App at: slack.com/downloads
2) Join or Create a Workspace: A workspace is a company’s shared hub, where team members communicate and work together in channels.
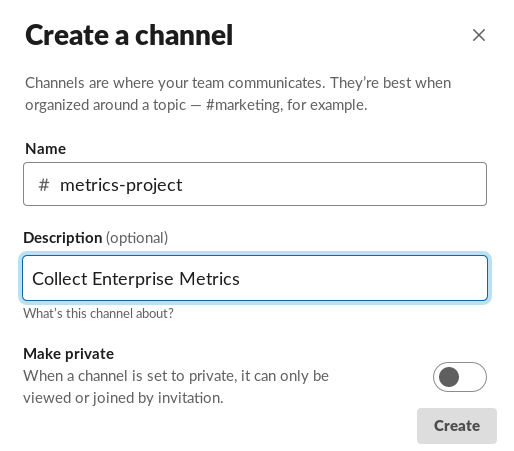
3) Create a Channel: Channels are where your team communicates. Choose for example “metrics-project” as channel.

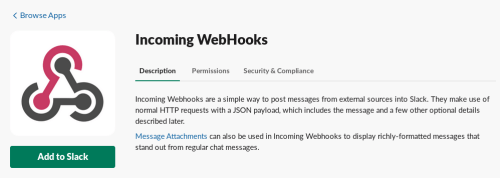
4) Go the Slack’s App directory (https://slack.com/apps) and search for Incoming Web Hooks. Incoming Webhooks are a simple way to post messages from external sources into Slack. They make use of normal HTTP requests with a JSON payload, which includes the message and a few other optional details.

Click “Add to Slack“
5) Choose the Channel where Incoming Web Hooks will post the messages, in our case the “metrics-project” channel.

You’ll be sent back to your app settings, and you should now see a new entry under the Webhook URLs for Your Workspace section, with a Webhook URL that’ll look something like this:
https://hooks.slack.com/services/T00000000/B00000000/XXXXXXXXXXXXXXXXXXXXXXXX
Take note of the Slack URL and keep it safe as it contains a secret! You are done with Slack. Now we need to start sending our metrics and alerts to Slack.
Creating Metrics and Alerts with Prometheus
We have already discussed this step in greater detail in this tutorial: Using Prometheus and Grafana to capture Alerts and visualize Metrics
However just to recap, here is the Prometheus configuration file (prometheus.yml) which loads Rules from the file rule.yml, scraping data from a Quarkus application running on localhost:8080 and sending alerts to the Alert Manager, available with the HTTP schema at localhost:9093
# my global config
global:
  scrape_interval:     15s # Set the scrape interval to every 15 seconds. Default is every 1 minute.
  evaluation_interval: 15s # Evaluate rules every 15 seconds. The default is every 1 minute.
  # scrape_timeout is set to the global default (10s).

# Alertmanager configuration
alerting:
   alertmanagers:
     - scheme: http
       static_configs:
         - targets: ['localhost:9093']

# Load rules once and periodically evaluate them according to the global 'evaluation_interval'.
rule_files:
  - "rules.yml"
  # - "second_rules.yml"

# A scrape configuration containing exactly one endpoint to scrape:
# Here it's Prometheus itself.
scrape_configs:
  # The job name is added as a label `job=<job_name>` to any timeseries scraped from this config.
  - job_name: 'prometheus'

    # metrics_path defaults to '/metrics'
    # scheme defaults to 'http'.

    static_configs:
    - targets: ['localhost:9090']

  # this is the configuration to poll metrics from Quarkus
  - job_name: 'metrics'
    scrape_interval: 15s

    static_configs:
      - targets: ['localhost:8080']
Here is the Rule file which collects the status of a Quarkus application, which emits metrics about its status:
groups:
- name: example
  rules:

  - alert: service_down
    expr: up{job="metrics"} == 0
    labels:
      severity: major
    annotations:
      description: Service {{ $labels.instance }} is unavailable.
      value: DOWN ({{ $value }})
Sending Alerts to Slack from the Alert Manager
The last piece of the puzzle is the Alert Manager component which is able to collect and forward messages to a Route. Edit the alertmanager.yml to include a slack receiver with the correct Slack URL and the Slack channel:
route:
 group_by: [cluster]
 # If an alert isn't caught by a route, send it slack.
 receiver: slack_general
 routes:
  # Send severity=slack alerts to slack.
  - match:
      severity: slack
    receiver: slack_general

receivers:
- name: slack_general
  slack_configs:
  - api_url: https://hooks.slack.com/services/T00000000/B00000000/XXXXXXXXXXXXXXXXXXXXXXXX
    channel: '#metrics-project'
That’s it. Let’s see how it works.
1) Shutdown your Quarkus application (or the one being monitored)
2) Start Prometheus Server and the AlertManager
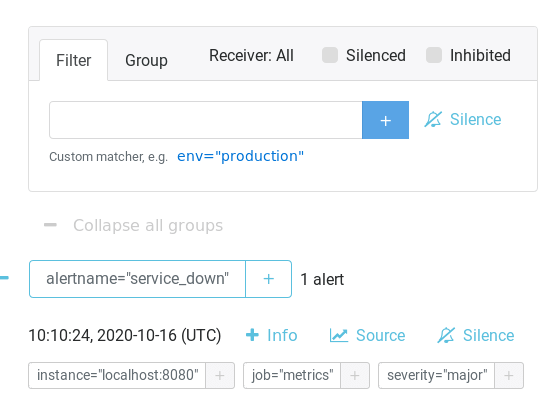
You will see that the Service Down Alert has been fired on the Alert Manager console:

Now switch to the Slack Channel where your alerts are being forwarded. As you can see, the Incoming Web Hooks has posted the message to the “metrics-project” channel.

It’s bare simple, isn’t it?
Found the article helpful? if so please follow us on Socials