One critical tool in diagnosing memory-related issues is the Heap dump, a snapshot of an application’s memory at a particular point in time. However, as applications become larger and more intricate, heap dumps can also become massive and challenging to analyze. In this article, we will learn how to examine Heap Dump data even with lightly equipped hardware.
Introducing Java Object Layout (JOL)
JOL is a Java Library which features a streaming Heap Dump parser that you can use to gather Heap Dump statistics. It does a single pass read of the Heap, therefore it takes little memory and time to complete.
You can use JOL in two ways:
- As command line tool (jol-cli.jar) to inspect info from an Heap Dump
- As an Application API, by adding it as dependency in your application
Let’s see them both in the next sections.
JOL Command Line Heap Inspection
Firstly, to run JOL as command line tool we need the jol-cli.jar file. You can either download the JAR file from the Maven Repository: https://mvnrepository.com/artifact/org.openjdk.jol/jol-cli/. If you prefer, you can grab the GitHub project https://github.com/openjdk/jol/ and build it.
As a proof of concept, we will be checking an Heap Dump which is 10GB:
10386852301 Aug 17 10:22 heapdump.hprof
This Heap Dump contains a huge cache of CustomPOJO which are never released in the code.
Let’s gather Heap Dump Statistics using the JOL CLI Tool. The syntax of the command is the following one:
java ./jol-cli/target/jol-cli.jar heapdumpstats <path-to-dump>
For the purpose of our example, we will start the jol-cli.jar with an upper Memory limit of just 1024MB:
java -Xmx1024m -jar ./jol-cli/target/jol-cli.jar heapdumpstats /path/heapdump.hprof
Here is the head of the Heap Dump Statistics:
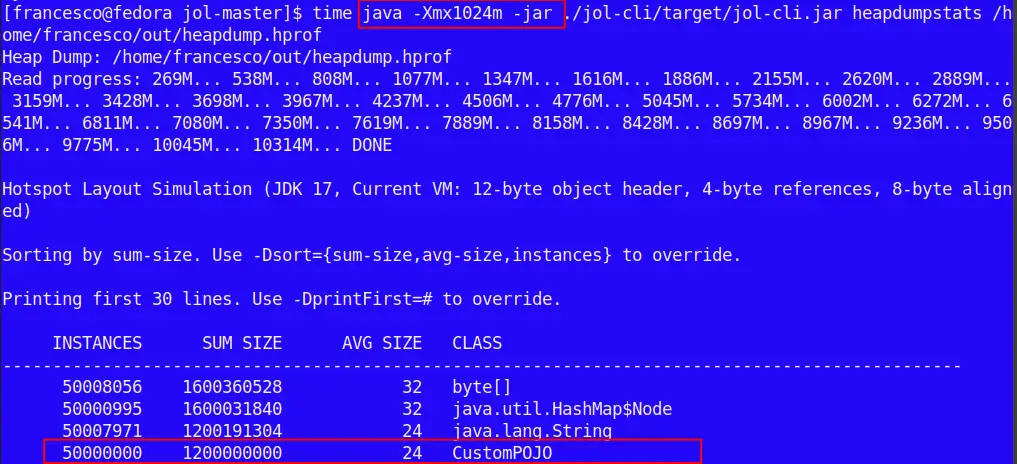
Within the Top lines of the Heap Dump Report we can see evidence of the large amount of CustomPOJO Objects which are retained in the Heap. We can adjust the Report according to the Java Options such as:
- sort: You can use it to determine how to sort the Report Data. Can be sum-size (default), avg-size, instances.
- printFirst: The number of lines to print (default 30)
Besides, the whole 10 GB Heap Analysis took really a snap: just 39 seconds of user’s time:

Further Analysis on the Dump
The Heap Dump statistics is a needful tool for an immediate inspection of a large Heap Dump. For more precise analysis, you would of course like to look at object graph (dominators, paths from roots, etc.). Eclipse MAT is an excellent to have a detailed view of your Heap Dump. You can learn more about Eclipse MAT in this article: Solving java.lang.OutOfMemoryError: java heap space
On the other hand, you will need a fairly amount of memory to open an Heap Dump with Eclipse MAT or equivalent tool. A common rule of thumb is to allocate at least 1.5 to 2 times the size of the heap dump. For a 10GB heap dump, you might want to allocate around 15-20GB of memory to MAT’s JVM.
A relatively cheaper option is to use Eclipse MAT’s command line tool to analyze your Dump. For example, here is how to build a report which includes suspects, overview and top components from the command line:
./ParseHeapDump.sh /opt/heap_dump/jvm.hprof org.eclipse.mat.api:suspects
./ParseHeapDump.sh /opt/heap_dump/jvm.hprof org.eclipse.mat.api:overview
./ParseHeapDump.sh /opt/heap_dump/jvm.hprof org.eclipse.mat.api:top_components
JOL Heap Inspection API
The JDK out of the box ships with some libraries to collect base statistics about your Memory usages. For example:
java.lang.management.MemoryMXBean: This interface provides methods to access information about the overall memory usage of the Java virtual machine (JVM).
java.lang.management.MemoryUsage: This class represents memory usage statistics, including used, committed, and maximum memory for different memory pools.
To perform a deeper analysis of your Memory usage, you can add to your Project the jol-core API:
<dependency>
    <groupId>org.openjdk.jol</groupId>
    <artifactId>jol-core</artifactId>
    <version>version</version>
</dependency>
With that library in place, you will be able to access the “org.openjdk.jol” Classes and collect details on your application programmatically.
Here is an example which you can bundle in a JBang script as follows:
///usr/bin/env jbang "$0" "$@" ; exit $?
//DEPS org.openjdk.jol:jol-core:0.17

import static java.lang.System.out;
import org.openjdk.jol.info.ClassLayout;
import org.openjdk.jol.vm.VM;


public class JOLSample_01_Basic {

    public static void main(String[] args) {
        out.println(VM.current().details());
        out.println(ClassLayout.parseClass(A.class).toPrintable());
    }

    public static class A {
        boolean f;
    }

}
Next, run the script with ‘jbang JOLSample_01_Basic‘. Here’s the output:
# VM mode: 64 bits
# Compressed references (oops): 3-bit shift
# Compressed class pointers: 0-bit shift and 0x800000000 base
# Object alignment: 8 bytes
#                       ref, bool, byte, char, shrt,  int,  flt,  lng,  dbl
# Field sizes:            4,    1,    1,    2,    2,    4,    4,    8,    8
# Array element sizes:    4,    1,    1,    2,    2,    4,    4,    8,    8
# Array base offsets:    16,   16,   16,   16,   16,   16,   16,   16,   16

JOLSample_01_Basic$A object internals:
OFF  SZ      TYPE DESCRIPTION               VALUE
  0   8           (object header: mark)     N/A
  8   4           (object header: class)    N/A
 12   1   boolean A.f                       N/A
 13   3           (object alignment gap)
Instance size: 16 bytes
Space losses: 0 bytes internal + 3 bytes external = 3 bytes total
This basic example shows a few interesting things such as:
- How much the object header consumes
- How fields are laid out
- How the external alignment beefs up the object size
You can find many other examples on the GitHub project: https://github.com/openjdk/jol/tree/master/jol-samples/src/main/java/org/openjdk/jol/samples
Conclusion
Parsing large heap dumps in Java is a crucial skill for diagnosing memory-related issues in complex applications. As applications continue to grow in size and complexity, the ability to efficiently analyze large heap dumps becomes increasingly important. By using specialized tools such as Java Object Layout (JOL) you can effectively navigate the challenges posed by large heap dumps and gain insights into memory-related problems. Remember that each application is unique, so experimentation and a combination of strategies might be necessary to achieve the best results.
Found the article helpful? if so please follow us on Socials


