Solving java.lang.OutOfMemoryError: java heap space
This article goes through the most common Java OutOfMemory Error, which happens when you saturate the Java Heap Memory. Within this article we will show how to fix this error depending if you are an application user or an application developer.
The Java Heap Space is the area of memory where the Java objects reside. When a Java program executes, the JVM (Java Virtual Machine) allocates some initial memory to the heap. The heap size can be increased or decreased based on the requirements of the application. However, if the heap size is not sufficient to hold the objects being created by the application, it will result in the following error:
java.lang.OutOfMemoryError: Java heap spaceThis error usually occurs when the heap size is not sufficient to hold the objects created by the application. It can also occur if there are too many objects in the heap and the garbage collection process is not able to reclaim enough space to accommodate new objects.
In general terms, there are two distinct ways to approach this problem. It depends whether you are an application user or an application developer.
Fixing Heap shortage as Application User
If you are an application final user, then you have no control over the source code of your application. Besides the obvious option to report the issue in the appropriate channel, the most common solution is to increase the heap size: You can do that by using the -Xmx and -Xms JVM options. For example, to increase the maximum heap size to 2048MB, you can use the following option:
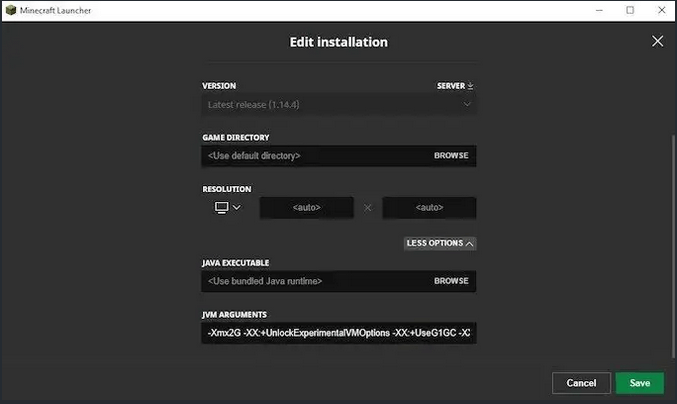
java -Xmx2048m MyProgramIt comes without saying that, you will need to apply the JVM settings in your application launcher. For example, if you want to allocate more Memory to Minecraft, you can set the JVM Arguments in the Minecract Launcher:
Much the same way, you might need to set the JVM memory for a Java tool such as Eclipse. In this case, you will need to change the -Xmx value in eclipse.ini:
-Xms256m
-Xmx2048m
In definitive, as application user, the most common way to handle the issue is finding the JVM configuration settings for your application. If that does not solve the issue, you are left only with the option to report the issue.
Fixing Heap shortage as Application Developer
If you are an application developer, it is likely that you have already attempted setting an higher -Xmx without success. Therefore we will check which are the most common causes of the Heap shortage
Application Memory Leak
Memory leaks can be a serious issue in Java applications, as they can lead to OutOfMemoryErrors and poor performance. In this section, we will go over the steps for finding and fixing a memory leak in a Java application.
Identify the symptoms of a memory leak. Some common symptoms of a memory leak include:
- The application’s memory usage continuously increases over time
- The application becomes slow or unresponsive
- The application throws an OutOfMemoryError
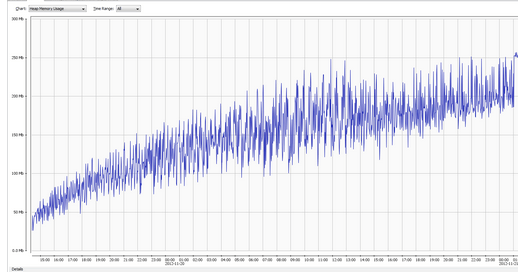
For example, the following JConsole diagram shows a Heap Memory graph. As you can see, the Heap keeps growing and does not recover with Garbage Collection enough memory:
A common best practice is to capture an Heap Dump of your Java application and examine the Java Object in the Heap. There are several ways to take a heap dump of a Java application. For example with jmap:
jmap -dump:format=b,file=heap.bin <pid>Replace the <pid> with your JVM PID. Besides the JVM option “-XX:+HeapDumpOnOutOfMemoryError” generates a heap dump when an OOME occurs.
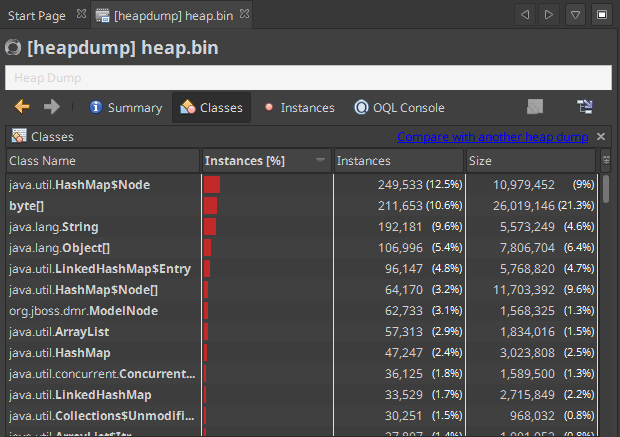
Next, check your Heap Dump with any tool that shows the Classes Instances of the snapshot. For example, with JVisualVM:
Learn more about JVisualVM here: Monitoring WildFly using VisualVM
Hint: Insert in the Class Name Filter to look for specific packages. Commonly, you can use your application packages but also any packages that retain Java objects. For example, connection pool packages.
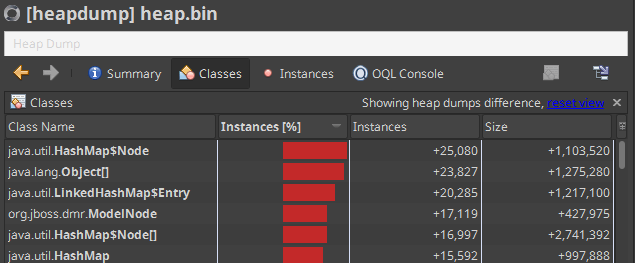
If you don’t have a specific clue about which package or Class you want to search, it is a good idea to take multiple Heap Dumps. For example, before and during the Heap Memory Peak usage. You can then use the Compare Heap feature which is available in JVisualVM or likewise in other tools.
In the above example, we are observing a growth of the java.util.HashMap$Node Class. This can be in relation with some Classes that are caching data in an HashMap. For example, in a WildFly application server, a candidate is the io.undertow.server.session.InMemorySessionManager.
Using Eclipse Mat for Advanced Memory Leak Analysis
Probably, the best tool for analyzing Memory Leak Suspects is Eclipse Mat. Firstly, when you open an Heap Dump with Eclipse Mat you have already a list of Problem Suspects. For example, let’s use Eclipse Mat to have a better insights of the latest Heap Dump:
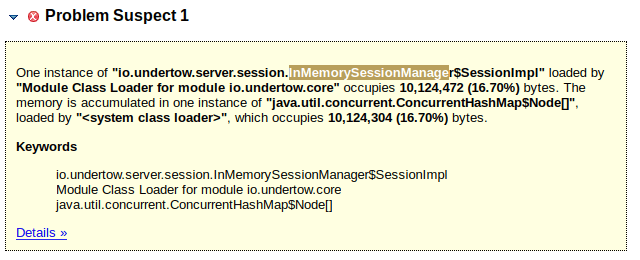
As you can see from the above Warning, Eclipse Mat reports a Leak Suspect . The suspect points to the HTTP Session of Undertow Web server. To simulate this error, we are simply adding a large set of Strings in the HTTP Session.
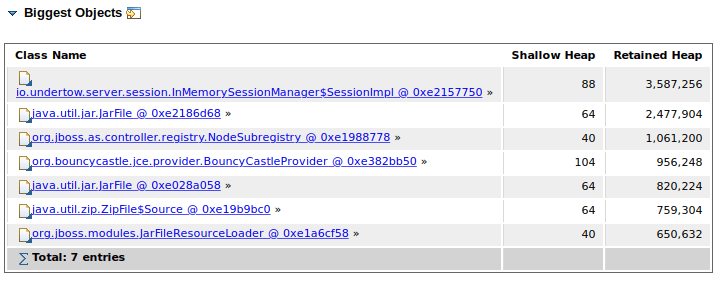
Next, from the Top Consumers Panel, you can check which are the biggest Java Objects in your JVM. For example:
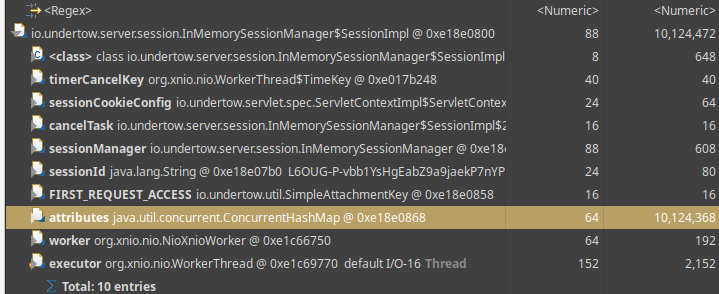
Finally, when you have a Leak Suspect, you can dig deeper in the Class through the incoming/outgoing references to see if an Objects holds references to other Java Objects and it numeric count:
Garbage Collection settings that can affect Heap Usage
In general terms, every modern Java Garbage Collector algorithms is quite efficient at reclaiming Memory.
You can however find significant differences between JVM versions. In particular, you can experience significant improvements from from JDK 8 through JDK 18. Therefore, the best recommendation is to stay on a more recent version of the JVM.
On the other hand, there are several settings that can influence the performance of the Garbage Collection and the JVM Heap size. The top ones are the HeapFree Ratios:
The -XX:MinHeapFreeRatio option (default 40) sets the minimum percentage of the heap that must be free after a garbage collection. You can use this option to ensure that there is always a certain amount of free space available in the heap.
Increasing the value of -XX:MinHeapFreeRatio will cause the JVM to leave a larger percentage of the heap free after garbage collections. This can potentially reduce the overall memory usage of the JVM, as there will be more space available to store new objects without requiring additional garbage collections.
The -XX:MaxHeapFreeRatio option (default 70) sets the maximum percentage of the heap that can be free after a garbage collection. If the percentage of the heap that is free exceeds this value, the garbage collector will attempt to reduce the size of the heap by allocating less memory to the application.
Reducing the value of -XX:MaxHeapFreeRatio will cause the garbage collector to be more aggressive at reducing the size of the heap after a garbage collection.This can potentially lead to a smaller overall heap size.
However, consider that a too aggressively garbage collection may result in more frequent collections. This means longer pauses in application execution.
Other Garbage collection settings that have an iimpact on Memory Consumption
Finally, we will mention some other JVM settings that can influence how often the Garbage Collection process kicks in:
- -XX:MaxGCPauseMillis=: Sets the maximum pause time in milliseconds that the garbage collector can take. Setting a lower value can cause the garbage collector to be more aggressive at reclaiming memory, but can also result in more frequent and longer pauses in application execution.
- -XX:GCTimeRatio=: Sets the ratio of garbage collection time to application time. Setting a lower value can cause the garbage collector to be more aggressive at reclaiming memory, but can also result in more frequent and longer pauses in application execution.
- -XX:+ExplicitGCInvokesConcurrent: Enables the use of concurrent garbage collection when your application issues a System.gc() . This can cause the garbage collector to be more aggressive at reclaiming memory, but can also result in more frequent pauses in application execution.
- -XX:+ExplicitGCInvokesConcurrentAndUnloadsClasses: Enables the use of concurrent garbage collection when you invoke System.gc(), and also unloads classes that are no longer needed.
- -XX:+UseCMSInitiatingOccupancyOnly: Enables the use of the concurrent mark-sweep garbage collector only when the occupancy of the old generation exceeds a certain threshold. This can cause the garbage collector to be more aggressive as well.
- -XX:CMSInitiatingOccupancyFraction=: Sets the occupancy threshold for the concurrent mark-sweep garbage collector as a percentage of the old generation. Setting a lower value can cause the garbage collector to be more aggressive at reclaiming memory, but can also result in more frequent and longer pauses in application execution.
- -XX:+CMSClassUnloadingEnabled: Enables class unloading during concurrent mark-sweep garbage collection. This also can cause the garbage collector to be more aggressive but can longer pauses in application execution and increased class loading overhead.
Finalizer thread under pressure
Finally, another possible cause of an OutOfMemory in the JVM Heap relates to the finalizer thread.
When an object is no longer being used, the Java garbage collector will mark it as eligible for finalization. The finalizer thread is responsible for calling the finalize() method on these objects. This will give them a chance to perform any necessary cleanup before they are permanently discarded. If the finalizer thread is unable to keep up with the number of objects being added to the finalizer queue, it can lead to an OutOfMemoryError.
Here are some possible things to check:
There are several potential causes for this error:
- Verify if your code is using objects that implement the finalize() method, but are not properly cleaning them up when they are no longer needed.
- Check with a Thread Dump if the finalizer thread is being blocked by some other operation, preventing it from processing the finalizer queue.
- Verify if the machine has enough resources (such as memory or CPU) to support the number of threads that are being created.
Conclusion
This article was a walk though some possible causes of a Java OutOfMemory error due to a shortage of Heap Memory. The causes can be multiple and often you will need to take an Heap Dump to initiate an analysis. If none of the above steps help, you may need to run your application on a machine with more memory or split your application into smaller processes that can run on separate machines.