WildFly uses a pool of Database Connection objects to your applications. A Connection Pool is a way to reduce the cost of opening and closing Database connections by maintaining a Pool of Database connections. In this article we will learn how to configure WildFly Connection Pool in an optimal way.
WildFly handles a pool of Database Connections in a Datasource and you can acquire a reference to the Datasource via JNDI. In order to understand how to install a Datasource and bind it into JNDI you can refer to this article: How to configure a Datasource with JBoss / WildFly
When using a Datasource, you have to balance the trade-offs between keeping connections open and opening/closing new connections. As a matter of fact, we want to size our connection pool such that we don’t have an high number of idle connections. On the other hand, we also want to be sure that the maximum number of connections reflects the max work that your application needs to perform.
Configuring the Datasource attributes
Firstly, when you create a Datasource there are some default settings: out of the box, there will be a maximum pool size of 20 and no minimum number of connections. In order to achieve optimal performance you should adjust these values based on your needs. Here is the list of attributes that you can configure with a short description:
- min-pool-size: The minimum number of connections in the pool (default 0)
- initial-pool-size: The initial number of connections to acquire from the database
- max-pool-size: The maximum number of connections in the pool (default 20)
- pool-use-strictmin: If true, idle connections below the minpoolsize will be closed
- pool-prefill: If true, WildFly attempts to prefill the connection pool with the minimum number of connections.
- flush-strategy: The flush strategy in case of an error. The default one (FailingConnectionOnly) forces destroying only connections with error.
- idle-timeout-minutes: Specifies the maximum time, in minutes, a connection may be idle before being closed. The actual maximum time depends also on the IdleRemover scan time, which is half of the smallest idletimeoutminutes value of any pool.
- track-statements: Whether to check for unclosed statements/resultsets when a connection returns to the pool. Valid values are: “false” do not track statements, “true” track statements and result sets and warn when they are not closed, “nowarn” track statements but do not warn about them being unclosed
How to change Connection pool size dynamically ?
If you are running a recent version of WildFly, you can change the Connection Pool size dynamically without disabling the Pool. For example:
/subsystem=datasources/data-source=ExampleDS:write-attribute(name=max-pool-size,value=50)
{
    "outcome" => "success",
    "response-headers" => {
        "operation-requires-reload" => true,
        "process-state" => "reload-required"
    }
}
Even though you can apply changes dynamically, you still need to reload the Server configuration for changes to take effect.
Tuning the Datasource
In order to understand how these attributes can affect your performance we need to check things from the beginning.
Firstly, when the application server starts, if you have in place an initial-pool-size, the datasource will be create that number of connections. Otherwise, you start with an empty pool.
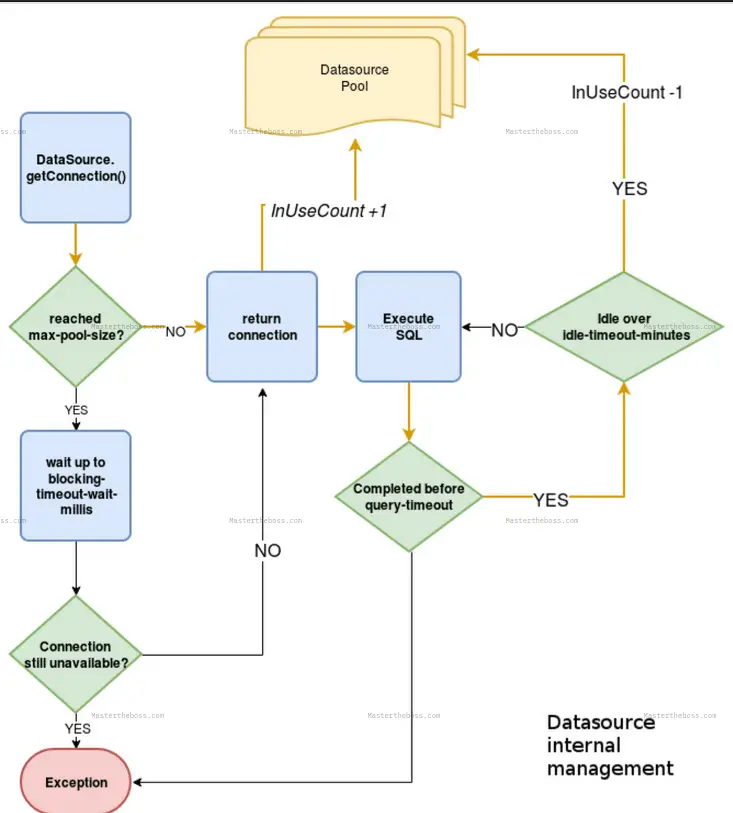
From now on, each time you request a Connection, the following check applies:
- If you any idle Connection is available. you will receive one of those connections that now becomes Active
- Otherwise, the application server will attempt to acquire a new database Connection.
In order to acquire a new database Connection, WildFly will check if you have reached the max-pool-size.
- If you haven’t reached the max-pool-size the new Connection will be created
- On the other hand, if you have hit the upper limit, WildFly will wait up to the blocking-timeout-wait-millis before throwing an Exception
When a Connection completes its Statement, it will become idle. A Connection can stay idle up to a maximum number of minutes as specified by the idle-timeout-minutes. After that, the Connection returns to the pool.
The pool-use-strict-min allows for a variation to this rule: If you set this parameter to true, idle connections below the min-pool-size will not return to the pool . They will stay idle, and quickly available to your applications.
For example, here is how to configure the min-pool-size and max-pool-size for an example datasource:
/subsystem=datasources/data-source=MySqlDS:write-attribute(name=min-pool-size,value=10)
/subsystem=datasources/data-source=MySqlDS:write-attribute(name=max-pool-size,value=50)
The following picture summarizes the flow of a Connection in the Pool:
Monitoring Runtime attributes of the Datasource
In order to tune your applications, it is essential to monitor the runtime attributes of the Database Pool. This will help you to discover if the Connection pool has enough connections to meet your requirements. It will also be a clue to detect Connection leaks. As a rule of thumb, you have to enable statistics on your Datasource first:
/subsystem=datasources/data-source=PostgrePool:write-attribute(name=statistics-enabled,value=true)
Then, you can query the statistics=pool Node to investigate the current number of active Database connections:
/subsystem=datasources/data-source=PostgrePool/statistics=pool:read-resource(include-runtime=true)
{
    "outcome" => "success",
    "result" => {
        "ActiveCount" => 3,
        "AvailableCount" => 17,
        "AverageBlockingTime" => 0L,
        "AverageCreationTime" => 32L,
        "AverageGetTime" => 33L,
        "AveragePoolTime" => 0L,
        "AverageUsageTime" => 0L,
        "BlockingFailureCount" => 0,
        "CreatedCount" => 3,
        "DestroyedCount" => 0,
        "IdleCount" => 0,
        "InUseCount" => 3,
. . . .
In this example, we have 3 active Database connections (“ActiveCount“) but we also have 3 “InUseCount” Connections. What does it mean?
- InUseCount tells us that there are 3 Connection objects which are executing SQL statements right now.
- ActiveCount tells us that there are 3 Active Database connections. If you see this number is never decreasing, it is a hint that you might not be closing connections properly.
How to detect Connection leaks
One way to detect Database connection leaks is using a combination of settings in the datasource and the jca subsystem. First, make sure that the Cached Connection Manager (use-ccm) is activated for the Datasource:
/subsystem=datasources/data-source=PostgrePool:read-attribute(name=use-ccm)
{
    "outcome" => "success",
    "result" => true
}
The above should be “true” by default. Then set to “debug” the Cached Connection Manager in the jca subsystem:
/subsystem=jca/cached-connection-manager=cached-connection-manager:write-attribute(name=debug,value=true)
That will instruct the Cached Connection Manager to close connections automatically for you. As a result, you will see the following message in your logs:
2020-08-21 13:04:54,946 INFO  [org.jboss.jca.core.api.connectionmanager.ccm.CachedConnectionManager] (default task-1) IJ000100: Closing a connection for you. Please close them yourself: org.jboss.jca.adapters.jdbc.jdk8.WrappedConnectionJDK82ba43757: java.lang.Throwable: STACKTRACE
	at org.jboss.ironjacamar.impl1.4.22.Final//org.jboss.jca.core.connectionmanager.ccm.CachedConnectionManagerImpl.registerConnection(CachedConnectionManagerImpl.java:308)
	at org.jboss.ironjacamar.impl1.4.22.Final//org.jboss.jca.core.connectionmanager.AbstractConnectionManager.allocateConnection(AbstractConnectionManager.java:819)
	at org.jboss.ironjacamar.jdbcadapters1.4.22.Final//org.jboss.jca.adapters.jdbc.WrapperDataSource.getConnection(WrapperDataSource.java:151)
	at org.jboss.as.connector20.0.0.Final//org.jboss.as.connector.subsystems.datasources.WildFlyDataSource.getConnection(WildFlyDataSource.java:64)
Finally, consider that you can dump the Datasource runtime statistics in your server log file by enabling this logger:
/subsystem=logging/logger=org.jboss.jca/:add(level=TRACE)
That will print the full list of static and runtime attributes for your Datasource in the server logs:
Pool:
  Name: PostgrePool
  Class: org.jboss.jca.core.connectionmanager.pool.strategy.OnePool
  Object: 316a6237
  FIFO: false
PoolConfiguration:
  MinSize: 0
  InitialSize: 0
  MaxSize: 20
  BlockingTimeout: 30000
  IdleTimeoutMinutes: 30
  ValidateOnMatch: false
  BackgroundValidation: false
  BackgroundValidationMillis: 0
  StrictMin: false
  UseFastFail: false
  Decrementer: org.jboss.jca.core.connectionmanager.pool.capacity.TimedOutDecrementer
Available (0):
InUse (1):
  668c5c34 (NORMAL) (CheckedOut: 1598007894938) (Validated: 1598007794843) (Usage: 10)
Statistics:
  ActiveCount: 1
  AvailableCount: 19
  AverageBlockingTime: 0
  AverageCreationTime: 17
  AverageGetTime: 9
  AveragePoolTime: 100086
  AverageUsageTime: 9
  BlockingFailureCount: 0
  CreatedCount: 1
  DestroyedCount: 0
  IdleCount: 0
  InUseCount: 1
. . . . .
Found the article helpful? if so please follow us on Socials


