In this article we will learn how to profile Java/Jakarta EE applications with NetBeans built-in profiler tool and how to instrument WildFly application server for this purpose.
There are several vendor tools for profiling Java applications such as JProfiler or YourKit. In the list of opensource tools, a valid option is NetBeans Profiler which lets you develop and profile your applications without leaving your IDE. As you will see, the NetBeans profiling tool easily enables you to monitor thread states, CPU performance, and memory usage of your application from within the IDE, and imposes relatively low overhead.
Using the Profiler for the First Time
The first time you are using the Profiler, you must have calibration data for each Java platform that will be used for profiling. The calibration only needs to be performed once. You can run the JVM calibration at any time by performing the following steps:
From the upper Menu, choose: Tools | Options | Java | Profiler | General | Manage Calibration Data:
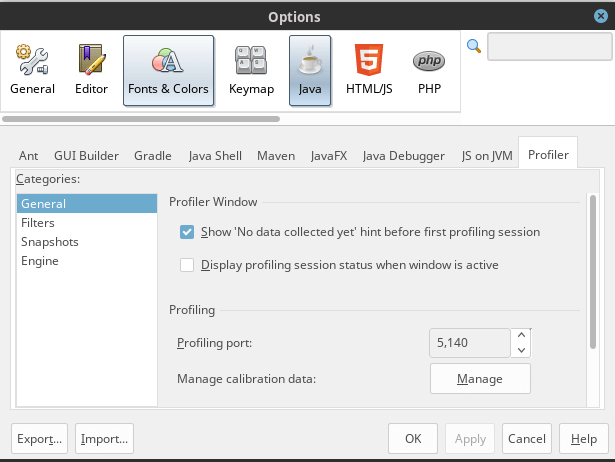
Click on the Manage button. Then, select the Java Platform. Click Calibrate. A dialog box will appear when the calibration operation is complete.
Next, we need to instrument WildFly so that it can be profiled. For this purpose, we need to add to WildFly modules the JFluid Server API which allows starting the full instrumentation profiling, calls to which are injected into the target application bytecodes when they are instrumented.
The required library, named jfluid-server.jar, is included into NetBeans distribution in the directory path $NETBEANS_HOME/profiler/lib/
A simple way to make it available globally as a module is to create a global directory and put the jar file in there:
$ mkdir $JBOSS_HOME/standalone/profile

$ cp jfluid-server.jar $JBOSS_HOME/standalone/profile
Then from WildFly CLI:
/subsystem=ee/global-directory=profiler:add(path="standalone/profiler", relative-to=jboss.home.dir)
Finally, we need to add the top package (“org.netbeans.lib“) where JFluid API is included in the list of JBOSS_MODULES_SYSTEM_PKGS:
if [ "x$JBOSS_MODULES_SYSTEM_PKGS" = "x" ]; then
   JBOSS_MODULES_SYSTEM_PKGS="org.jboss.byteman,org.netbeans.lib"
fi
Profiling your Jakarta EE applications
There are two ways to profile Enterprise applications using NetBeans:
1) Start an application or a Server in Profile mode
This can be achieved by selecting the “Services” Tab and from there start the application server. For example, WildFly Application Server | Start in Profile Mode:
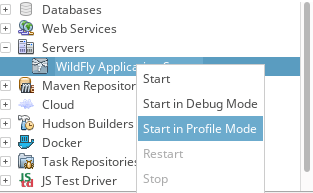
Please note that there’s currently an issue with NetBeans on OpenJDK 11 (https://issues.apache.org/jira/browse/NETBEANS-2452) which causes the unsupported option “-Xbootclasspath/p” to be added to your Java Options:
“-Xbootclasspath/p is no longer a supported option.
2) Attach to an existing JVM Process
The most stable option is to start the application server externally and then attach to it.
We will therefore start WildFly from the command line:
$ ./standalone.sh
From the NetBeans Menu, select “Profile | Attach to External Process“
Click on the Profile button, then, select the PID of your WildFly (or other JVM)server and click on it to attach to the process:
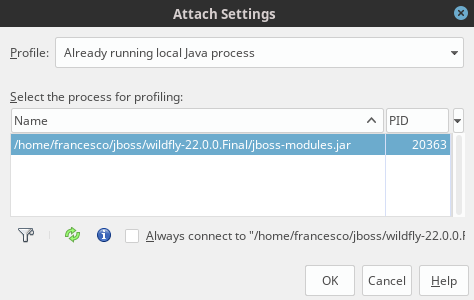
NOTE: If your connection to the WildFly process is hanging on and you are sure the connection should work (i.e. you double checked all the standard things like firewalls, network configuration etc.) the RMI system property java.rmi.server.hostname is something to try:
$ ./standalone.sh -Djava.rmi.server.hostname=localhost
Profiling applications
If you click on the arrow next to the “Attach” button, you will see that several options are available:
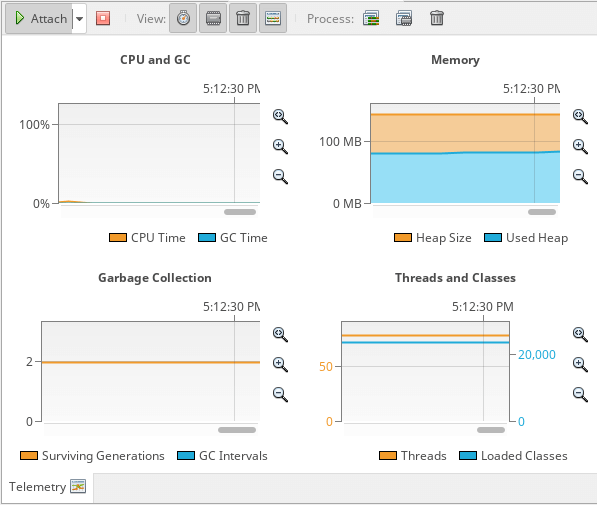
Telemetry:
Within this panel, you can have a real time high-level information about properties of the target JVM
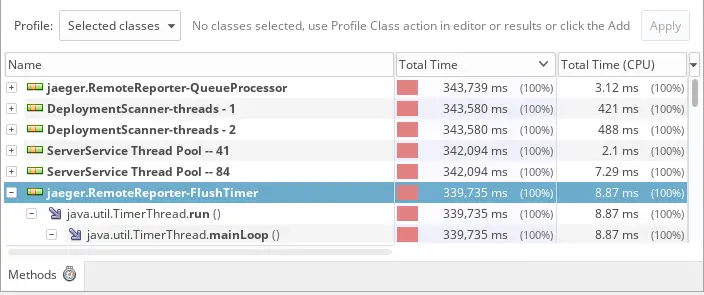
Methods:
From within this panel, you will be able to hotspot the Total time spent on each method and amount of Total CPU time for the same method. You can also apply filters to packages and classes to narrow your search.
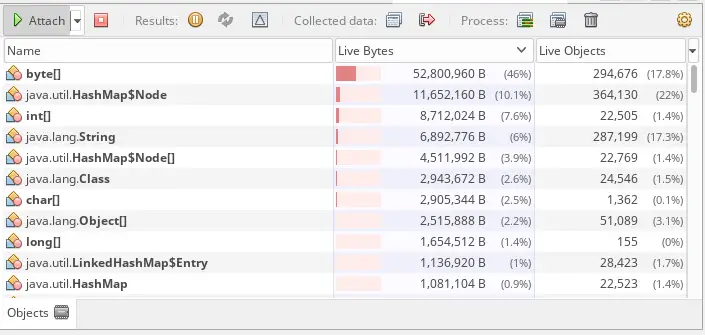
Objects:
From this panel you will be able to measure the amount of Bytes and number of objects created. This is a precious hint to find memory leaks in your applications
Threads:
This is a performance view of the time spent running each Thread:

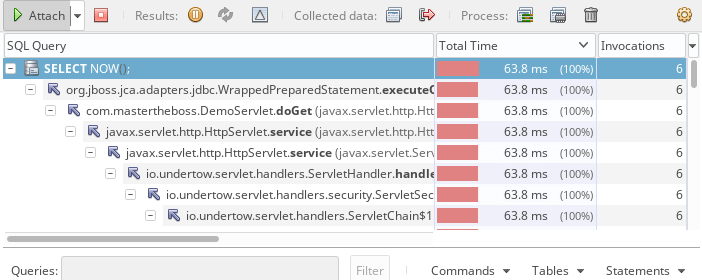
SQL Queries:
Within this panel you will be able to track the performance of JDBC calls and the number of executions
Taking Snapshots
When running a profiling session, you can capture the results by taking a Snapshot. A snapshot captures the profiling data at the instant you take the snapshot. Snapshots differ from live profiling results in the following ways:
- Snapshots can be checked when no profiling session is running.
- Snapshots contain a more detailed record of profiling data than live results.
- A Snapshot cam be compared with another Snapshot to compare memory usage
This concludes our short ride on profiling an application using NetBeans IDE. In this tutorial we showed the basics of how to use an opensource IDE to profile a Jakarta EE application server and view the profiling results. The steps outlined above can also be applied for other profiler tools such as VisualVM. Mind it, the jfluid API on VisualVM is located under a different package so you will have to change the JBOSS_MODULES_SYSTEM_PKGS accordingly:
if [ "x$JBOSS_MODULES_SYSTEM_PKGS" = "x" ]; then
   JBOSS_MODULES_SYSTEM_PKGS="org.jboss.byteman,org.graalvm.visualvm"
fi
Found the article helpful? if so please follow us on Socials