The Microprofile Opentracing specification defines a set of API for accessing an OpenTracing compliant Tracer object within the JAX-RS application. The behaviors specify how in/out requests will have OpenTracing Spans automatically created. The API also defines how to explicitly disable or enable tracing for given endpoints.
WildFly 14 provides initial support for OpenTracing API and in this tutorial we will learn how to trace a simple JAX-RS application.
You can use the @org.eclipse.microprofile.opentracing.Traced annotation to define explicit span creation for specific classes and methods. If you place the annotation on a class, then it’s automatically applied to all methods within that class. If you place the annotation on a method, then it overrides the class annotation if one exists.
Here’s an example of an EJB annotated with @Traced:
import javax.ejb.Stateless;
import org.eclipse.microprofile.opentracing.Traced;

@Stateless
@Traced
public class TracedEJB {
    public void onNewOrder() {
        System.out.println("Action through EJB!");
    }
}
Typically we would include tracing for JAX-RS endpoints which are the entrypoint for remote requests. Here’s an endpoint eligible to be Traced:
@Stateless
@Path("/restendpoint")
public class ExampleEndpoint {
    @POST
    @Path("/post")
    public String execute() {
        return "Action executed!";
    }
}
TECH TIP: JAX-RS endpoint are automatically marked as “CDI archive”, which is enough to trigger the MicroProfile OpenTracing integration and provide metrics without any annotation.
In order to be able to collect metrics we need at first to start a distributed tracing server like Jaeger to collect tracing metrics. We can do it convenientely with Docker:
docker run \
  --rm \
  --name jaeger \
  -p6831:6831/udp \
  -p16686:16686 \
jaegertracing/all-in-one:1.6
Now we can start WildFly. Before launching the application server, some environment variables needs to be exported:
export JAEGER_REPORTER_LOG_SPANS=true
export JAEGER_SAMPLER_TYPE=const
export JAEGER_SAMPLER_PARAM=1
export JAEGER_SERVICE_NAME=opentracing-example
- JAEGER_SAMPLER_PARAM is used to make the same decision for all traces. It either samples all traces (param=1) or none of them (param=0).
- JAEGER_REPORTER_LOG_SPANS cheks whether the reporter should also log the spans.
- JAEGER_SAMPLER_TYPE is used to configure the sampler type.
- JAEGER_SERVICE_NAME is the service name
WARNING: Support for OpenTracing is still work-in-progress for WildFly 14.0.0.Final. We recommend using a nightly build of it or version newer than 14.0.0 to run this example.
When WildFly starts, you can check from the logs that the JaegerTracer environment has been correctly initialized:
19:02:07,216 INFO [io.jaegertracing.Configuration] (ServerService Thread Pool -- 34) Initialized tracer=JaegerTracer(version=Java-0.30.6, serviceName=opentracing-example, reporter=CompositeReporter(reporters=[RemoteReporter(sender=UdpSender(), closeEnqueueTimeout=1000), LoggingReporter(logger=org.slf4j.impl.Slf4jLogger(io.jaegertracing.internal.reporters.LoggingReporter))]), sampler=ConstSampler(decision=true, tags={sampler.type=const, sampler.param=true}), tags={hostname=localhost, jaeger.version=Java-0.30.6, ip=127.0.0.1}, zipkinSharedRpcSpan=false, expandExceptionLogs=false)
Now you can file some requests for your application, for example:
curl -X POST localhost:8080/mp-opentracing/restendpoint/post

curl -X GET localhost:8080/mp-opentracing/trace
You should be able to see on the application server console that some Spans have been found:
19:02:43,814 INFO [io.jaegertracing.internal.reporters.LoggingReporter] (default task-17) Span reported: fee6c5acf732f13b:fee6c5acf732f13b:0:1 - POST:com.mastertheboss.opentracing.ExampleEndpoint.execute

19:02:49,140 INFO [io.jaegertracing.internal.reporters.LoggingReporter] (default task-17) Span reported: 2ba4a2d55b38dbba:2ba4a2d55b38dbba:0:1 - com.mastertheboss.opentracing.TracedEJB.onNewOrder
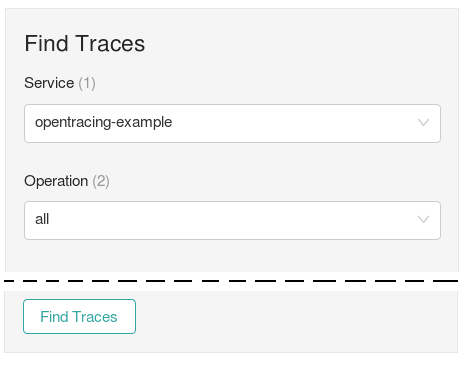
Now reach out Jaeger UI to check if the Spans have been collected: http://localhost:16686/search

Click on Find Traces to see the samples you have collected so far:

WildFly Administration Guide
This article is an excerpt from “WildFly Administration Guide“, the only book which is always updated with the newest features of the application server!

The source code for this example is available at: https://github.com/fmarchioni/mastertheboss/tree/master/micro-services/mp-opentracing
Found the article helpful? if so please follow us on Socials