Jolokia is a cool monitoring solution for accessing JMX MBeans remotely. It is different to JSR-160 connectors in so far as it is an agent based approach which uses JSON over HTTP for its communication in a REST-stylish way.
As any monitoring solution, an agent is required to interact with the application. Multiple agents are provided for different environments:
- WAR Agent for deployment as web application in a JEE Server.
- OSGi Agent for deployment in an OSGi container. This agent is packaged as a bundle and comes in two flavors (minimal, all-in-one).
- Mule Agent for usage within a Mule ESB
- JVM Agent which can be used with any Oracle/Sun JVM, Version 6
In this tutorial we will deploy the WAR agent on JBoss AS 7 and access the JMX deployed on the server. So as first step, move to the download page and download the WAR Agent. Once downloaded renamed it for your convenience as jolokia.war and drop it into the deployments folder of your standalone server.
First test: let’s see if Jolokia responds correctly: issue the following GET request:
http://localhost:8080/jolokia/
You should see the following JSON response:
{
   "timestamp":1341845890,
   "status":200,
   "request":{
      "type":"version"
   },
   "value":{
      "protocol":"6.1",
      "agent":"1.0.4",
      "info":{
         "product":"jboss",
         "vendor":"RedHat",
         "version":"7"
      }
   }
}
Now let’s try something more complex, but we need to know how the application server MBeans tree looks like. For this purpose you can issue the following GET request: http://127.0.0.1:8080/jolokia/list
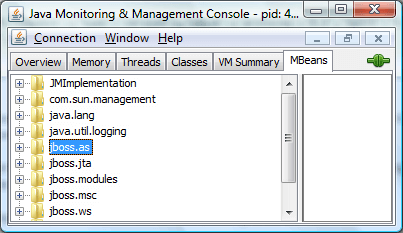
This will produce a quite verbose list of the MBeans running on the server. However, it would be easier to grasp it with the JConsole tools which shows in the Mbeans tab all the Mbeans in a tree-like structure.
In order to read an MBean property you can use the REST’s read path as in the following example, where we are investigating on the ExampleDS Datasource (Use the ignoreErrors=true argument in order to avoid failures if some attributes are unreadable).
http://localhost:8080/jolokia/read/jboss.as:subsystem=datasources,data-source=ExampleDS?ignoreErrors=true
{
   "timestamp":1341843446,
   "status":200,
   "request":{
      "mbean":"jboss.as:data-source=ExampleDS,subsystem=datasources",
      "type":"read"
   },
   "value":{
      "validConnectionCheckerProperties":null,
      "allocationRetryWaitMillis":null,
      "preparedStatementsCacheSize":null,
      "trackStatements":"\"NOWARN\"",
     . . . . .
      "setTxQueryTimeout":false,
      "backgroundValidationMillis":null,
      "maxPoolSize":null,
      "minPoolSize":null,
      "connectionUrl":"jdbc:h2:mem:test;DB_CLOSE_DELAY=-1",
      "jndiName":"java:jboss\/datasources\/ExampleDS",
      "newConnectionSql":null
   }
}
Another example, which digs into the AS Thread pool:
http://localhost:8080/jolokia/read/java.lang:type=Threading
{
   "timestamp":1341843401,
   "status":200,
   "request":{
      "mbean":"java.lang:type=Threading",
      "type":"read"
   },
   "value":{
      "ThreadContentionMonitoringSupported":true,
      "SynchronizerUsageSupported":true,
      "ThreadAllocatedMemoryEnabled":true,
      "ThreadCpuTimeEnabled":true,
      "PeakThreadCount":83,
      "CurrentThreadCpuTime":3884424900,
      "DaemonThreadCount":25,
      "CurrentThreadCpuTimeSupported":true,
      "TotalStartedThreadCount":96,
      "AllThreadIds":[
         101,
. . . . .
         8,
         5,
         4,
         3,
         2
      ],
      "ThreadContentionMonitoringEnabled":false,
      "ObjectMonitorUsageSupported":true,
      "ThreadAllocatedMemorySupported":true,
      "CurrentThreadUserTime":3775224200,
      "ThreadCount":43,
      "ThreadCpuTimeSupported":true
   }
}
In the following example we are using the exec command to execute an MBean command: in this case we will issue a redeploy command on the web application named myapp.war: http://localhost:8080/jolokia/exec/jboss.as:deployment=myapp.war/redeploy
Pretty nice. One thing you might need is interacting with the AS MBeans programmatically. There are several options for it (including Javascript). We will use a plain Java Client. In order to use the Jolokia Java API, you need to donwload a few libraries:
And the following dependencies:
So, once downloaded all the required libs, in the following example we will create a minimal Java client which issue a read request on the HeapMemoryUsage object:
package com.sample;

import org.jolokia.client.*;
import org.jolokia.client.request.*;

import java.util.Iterator;
import java.util.Map;
import java.util.Set;

public class JmxClient {

   public static void main(String[] args) throws Exception {
       J4pClient j4pClient = new J4pClient("http://localhost:8080/jolokia/");
       J4pReadRequest req = new J4pReadRequest("java.lang:type=Memory",
                                               "HeapMemoryUsage");
       J4pReadResponse resp = j4pClient.execute(req);
       Map vals = resp.getValue();
       Set set = vals.keySet();
       Iterator i = set.iterator();
       while (i.hasNext()) {
           Object key = i.next();
           System.out.println(key + " = " +vals.get(key));
       }


   }
}
which will produce:
max=518979584
committed=65011712
init=67108864
used=26947208
j4psh vs JBoss CLI
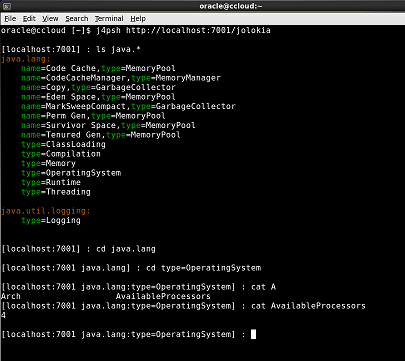
Jolokia includes j4psh which is a JMX shell which is using standard MBean names, provides syntax highlighting together with code completion and even wildcard patterns. In j4psh you will be using similar command as JBoss AS 7 CLI.
Here’s a partial list of the most useful j4psh commands:
- connect, to connect to an Java EE server with the jolokia.war deployed or using the Java agent
- pwd, to find out the current MBean name or domain
- cd, to navigate to an MBean or domain
- ls, to list MBean details (works with * and can be restricted as “ls -a” for attributes and “ls -o” for operations).
- cat, to display attribute values
Here’s a snapshot of the j4psh shell:

Although the two products are not aiming at the same target (the CLI is the official AS7 administration and configuration tool, while the Jolokia shell is designed to interact with the AS Mbeans) we can try a comparison of them:
| Functionality | JBoss CLI | j4psh |
| Installation | Built-in in JBoss AS 7 | Need installing jmx4perl |
| Availability | Specific of JBoss AS 7 | Multivendors (Most other application servers, Mule agent, JVM agent OSGi agent) |
| Syntax | Proprietary shell-like syntax | Standard MBean name |
| Autocompletion | yes | yes |
| Syntax highlighting | no | yes |
| Commands history | yes | yes |
| Take system snapshot | yes | no |
| Return format | Text, XML | JSON |
| Accessible Data | All application server subsystems | All accessible MBeans |
| Authentication | Role based authentication. | (SSL, HTTP-Authentication) and support for custom policies. |
| Firewall friendly | Requires opening port on the firewall | Communication is over HTTP, proxying through firewalls becomes mostly a none-issue |
| Bulk requests | The batch mode allows one to group commands and operations and execute them together as an atomic unit. | Can process many JMX requests with a single roundtrip. |
| Multiplatform | No | Available also to Javascript and Perl clients |
| Non interactive mode | Possible to send multiple requests using non-interactive mode | No |
| GUI mode | Available GUI interface | No |
| Resource shortcuts | Available shortcuts for creation of most common resources (JMS destinations/ Datasources) | No |
| Server and Domain management | yes | No |
So, as you can see, although j4psh and the AS 7 CLI bear some similarities, the AS 7 CLI is the defacto administration and management tool. On the other hand j4psh and Jolokia is a very cool addition for interacting with the server MBeans thanks to its multiplatform and multivendor availability.
Found the article helpful? if so please follow us on Socials