Micrometer is a metrics instrumentation library for Java applications. It provides a simple facade over the instrumentation clients for a number of popular monitoring systems. In this tutorial, we will learn how to use Micrometer API in a Jakarta EE application with WildFly or a Quarkus application.
Firstly, we will cover the Micrometer configuration using two popular options: WildFly application Server and Quarkus. Then, we will look at the Micrometer API which can be used in both Runtimes.
MicroMeter set up on WildFly
To use MicroMeter on WildFly, firstly download WildFly 28 (or newer). Next, you need to add the available extension to your WildFly Configuration and define an endpoint for your Metrics:
/extension=org.wildfly.extension.micrometer:add
/subsystem=micrometer:add(endpoint="http://localhost:4318/v1/metrics")
reload
Finally, you need to include the following dependency in your Jakarta EE project:
<dependency>
    <groupId>io.micrometer</groupId>
    <artifactId>micrometer-registry-prometheus</artifactId>
    <version>1.7.6</version>
</dependency>
MicroMeter set up on Quarkus
To run MicroMeter applications on Quarkus, simply drop the quarkus-micrometer-registry-prometheus dependency in your Quarkus project:
<dependency>
    <groupId>io.quarkus</groupId>
    <artifactId>quarkus-micrometer-registry-prometheus</artifactId>
</dependency>
Micrometer vs MicroProfile Metrics
Micrometer and MicroProfile Metrics API are both metrics instrumentation libraries for Java applications. However, there are some differences between them.
One key difference is that Micrometer provides a simple facade over the instrumentation clients for multiple monitoring systems, while MicroProfile Metrics API is designed specifically for use with MicroProfile-compatible application servers.
Another difference is that Micrometer provides more advanced features such as hierarchical meters and dimensional data models, while MicroProfile Metrics API provides a simpler API with basic metric types such as counters and gauges.
In summary, if you are using a MicroProfile-compatible application server and only need basic metrics instrumentation, you may want to use MicroProfile Metrics API. However, if you need more advanced features or want to use multiple monitoring systems, Micrometer may be a better choice.
To learn more about the Metrics API, check this article: Microprofile Metrics using WildFly application Server
How to use Micrometer API
Once you that your set up is complete, you can start using it in your application. You can use the MeterRegistry bean to create and register meters such as counters, gauges, and timers.
@Inject
private MeterRegistry registry;
The following meters are available:
- Gauge: A Gauge measures resource usage, capacity, etc. This is the simplest kind of meter you can use in your application
- Counter: A Counter measures a number of events or actions – a value that only increases, and never decreases.
- Timer: A Timer measures short-duration events and their frequency such as method execution time, request duration, etc.
- DistributionSummary: This metric captures a set of values and its output is a distribution of count,sum and max for the recorded values during the push interval.
Using a Gauge
Here is an example REST Method which uses a Gauge Meter to store an attribute, which you can later set or get:
@GET
@Path("gauge")

public int gauge() {

    AtomicInteger myGauge = registry.gauge("numberGauge", new AtomicInteger(0));

    // ... then you can update the value using the object reference
    myGauge.set(10);
    return myGauge.get();

}
Using a Counter
The following sample code creates a Counter with the name “dummy” which is incremented at every iteration of the method:
@GET
@Path("counter")
public String counter() {

    registry.counter("dummy").increment();
    return "Counter is " + registry.counter("dummy").count();
}
Using a Timer
You can use a Timer to measure the execution time for a method. The method record of the Timer object allows to start recording the time. then, the totaltime returns the time spent in the execution:
@GET
@Path("timer")
@Timed(value = "mytimer")
public double timer() {

    Timer timer = registry.timer("demo_timer", Tags.of("ts", "" + System.currentTimeMillis()));
    // recording execution time of code
    timer.record(() -> {
        try {
            Thread.sleep((long) (Math.random() * 1000L));
        } catch (InterruptedException e) {
            throw new RuntimeException(e);
        }

    });
    return timer.totalTime(TimeUnit.MILLISECONDS);

}
Please notice in this example we show how to use Tags with a Meter object. In Micrometer, Tags are key-value pairs that you can associate with metrics to provide additional dimensions for aggregation and filtering. Tags allow you to add more context to your metrics and make it easier to query and analyze your data.
For example, let’s say you have a web application and you want to track the number of HTTP requests it receives. You could create a counter and increment it every time a request is received. However, this would only give you the total number of requests, without any additional information.
By using tags, you can add more context to your metrics. For example, you could add tags for the HTTP method, the URI, and the response status code. This would allow you to see not only the total number of requests but also how many requests were GET requests, how many were for a specific URI, and how many resulted in a specific status code.
Using a Distribution Summary
Finally, we show how to use a DistributionSummary. A DistributionSummary in Micrometer is a metric type that can be used to track the distribution of a large number of measurements. It is similar to a histogram, but it allows you to track the distribution of non-integer values such as response sizes or latencies.
@GET
@Path("summary")

public void summary() {

    DistributionSummary summary = DistributionSummary
    .builder("my_summary")
    .description("The summary description") // optional
    .register(registry);
    // Record values to distributionSummary
    summary.record(10);
    summary.record(20);
    summary.record(30);

}
Capturing MicroMeter Metrics
At the beginning of this article, we have configured WildFly to send our Metrics to a Collector available at this address:
/subsystem=micrometer:add(endpoint="http://localhost:4318/v1/metrics")
We will show here how to bootstrap the OpenTelemetry (OTel) connector which will collect the Metrics from WildFly application. To do that, you need to configure Docker on your machine. Then, add the following docker-compose.yml file:
version: "3"
volumes:
  shared-volume:
    # - logs:/var/log
services:
  otel-collector:
    image: otel/opentelemetry-collector
    command: [--config=/etc/otel-collector-config.yaml]
    volumes:
      - ./otel-collector-config.yaml:/etc/otel-collector-config.yaml
    ports:
      - 1888:1888 # pprof extension
      - 8888:8888 # Prometheus metrics exposed by the collector
      - 8889:8889 # Prometheus exporter metrics
      - 13133:13133 # health_check extension
      - 4317:4317 # OTLP gRPC receiver
      - 4318:4318 # OTLP http receiver
      - 55679:55679 # zpages extension
      - 1234:1234 # /metrics endpoint
This YAML file bootstraps the otel/opentelemetry-collector, opening a set of ports on your machine to expose the metrics. Finally, the –config command allows to define the OpenTelemetry (OTel) connector in the following external file otel-collector-config.yaml:
extensions:
  health_check:
  pprof:
    endpoint: 0.0.0.0:1777
  zpages:
    endpoint: 0.0.0.0:55679

receivers:
  otlp:
    protocols:
      grpc:
      http:

processors:
  batch:

exporters:
  prometheus:
    endpoint: "0.0.0.0:1234"

service:
  pipelines:
    metrics:
      receivers: [otlp]
      processors: [batch]
      exporters: [prometheus]

  extensions: [health_check, pprof, zpages]
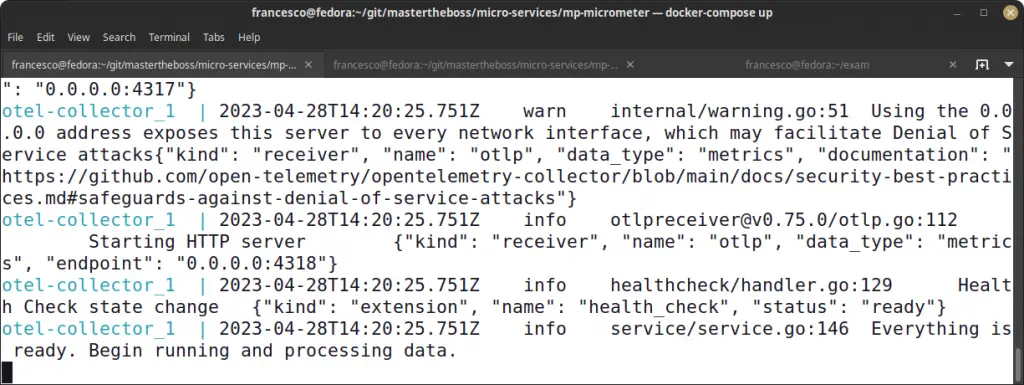
You can start the Collector with:
docker-compose up
Verify that everything is ready to go:
Then, you can start requesting the REST Endpoint on WildFly or Quarkus. For example:
curl http://localhost:8080/micrometer/demo/counter
Finally, check on the available metrics at the following endpoint:
http://localhost:1234/metrics
For example:
curl -s http://localhost:1234/metrics | grep dummy
# HELP dummy
# TYPE dummy counter
dummy{job="wildfly"} 8
Conclusion
Micrometer is a powerful tool for collecting and monitoring performance data in Java applications, including those built with Jakarta EE. By configuring a registry and creating metrics, you can easily track important statistics like response times and error rates. While the MicroProfile Metrics API provides similar functionality, Micrometer offers a more modern and flexible solution with support for a wider range of monitoring systems.
Thanks to Jason Lee and Brian StansBerry for providing useful hints on MicroMeter configuration.
Source code: https://github.com/fmarchioni/mastertheboss/tree/master/micro-services/mp-micrometer
Found the article helpful? if so please follow us on Socials


