If you are looking for ways to tune JBoss / WildFly applications, we have more updated tuning resources. Please check:
What is JBoss Profiler ? JBoss Profiler is a log based profiler which uses an agent written in C that captures events from the JVM and logs to disk. You can then use the Profiler web application to analyze these logs through a web browser.
Why using a profiler ? Imagine your application slows down or simply consumes lots of memory. Instead of installing a complex tool environment or have to send data through an open port, breaking firewall rules between the profiler front-end and the JVM, simply run the JBoss Profiler.
JBossProfiler is also able to produce profiling snapshots which can be analyzed remotely to solve this problems or can be submitted when a bug is discovered. Configuring JBossProfiler is just a matter of installing MBeans and adding a simple parameter to your JVM.
Let’s see how:
First of all download JProfiler from JBoss site. For this article we’ll use JBossProfiler 1.0 CR 4
Now change your JBoss start script, including the following option:
set JAVA_OPTS=%JAVA_OPTS% -XrunjbossInspector:C:\jboss-4.2.0.GA\mem,include=profile,ignore=*
whereas for Unix environment simply add:
JAVA_OPTS="$JAVA_OPTS -XrunjbossInspector:/jboss-4.2.0.GA/mem,include=profile,ignore=*"
Two things to notice here: the parameter after -XrunjbossInspector which indicates the position of snapshots and log files.(C:\jboss-4.2.0.GA\mem)
Second: the directive include=profile,ignore=* which is optional but let us record only classes which belong to the package profile.* (Supposing we deploy an application with package profile.*)
Add JBossInspector library to the PATH environment variable (the library can be found under jboss-profiler-1.0.CR4\jvmpi ) choose the one appropriate for your environment.
Now add the MBean named jboss-profiler-noAOP.sar under the JBoss deploy dir. Finally deploy in the same directory the web application jboss-profiler.war. This tree summarize this simple steps
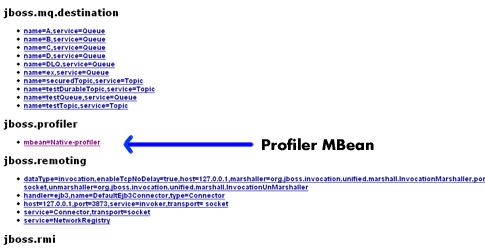
Ok. Start JBoss application server. At this point the Profiler is not yet active, you have to wake it up using a simple MBean call. The simplest way to do it is pointing at the JMX console
http://localhost:8080/jmx-console
Now look for JBossProfiler:JVMTI MBean (mbean=JVMTIClass).

Once in the MBean view, start the profiler clicking on the “Start data capturing.” button. Finished.
Now you can start your application testing.
Once completed go back to the jmx console and stop data collection by clicking the stop() Mbean button.
All right, now let’s see deep inside JBoss Application server! Let’s invoke the Profiler web application:
http://localhost:8080/jboss-profiler

What we want to do now is a Runtime Profiler, so click on the appropriate link and in the next page you’ll be requested the log file directory (Remember we discussed about it before ?), in our case C:\jboss-4.2.0.GA\mem
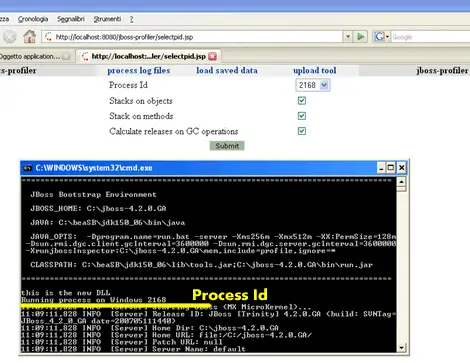
In the next screen you may select if you want analyze the stack of objects, method and garbage collection release time. Leave everything checked. Just in case you have launched the Profiler several times you need to select between more Process ids. So which is yours ? don’t panic, just look at the JBoss start logs and you’ll find it easily.

Ok, now be patient for a minute while logs are analyzed by the profiler. When you’re done click on the “Finished Link” and you’ll see the core section of the profiler.
In our sample code we can see the method renderCar is executed 1000 times and is responsible of 70,76% of CPU time and 69.33% of execution time. The method findCars, which execute a query, takes up to 16,6% of execution time and about the same of CPU time.

Problem 2: How many objects are playing around ?
Besides showing the trace details of the method execution you have several options to detect vital information about your application now click on the “Instances Created” menu. In the next screen you’ll have a dump of all objects created and released by the method findCars:
profile.dao.CarDAO.findCars = 100% calls=1
|
Class Name
|
Number of Instances
|
Bytes
|
|
java.lang.String
|
68
|
1632
|
|
java.io.File
|
11
|
176
|
|
java.lang.StringBuffer
|
9
|
144
|
|
java.lang.StringBuilder
|
9
|
144
|
|
java.lang.Boolean
|
8
|
128
|
|
java.util.HashMap$Entry
|
6
|
144
|
|
java.io.ExpiringCache$Entry
|
4
|
96
|
|
java.util.LinkedHashMap$Entry
|
4
|
128
|
|
java.lang.ClassNotFoundException
|
3
|
96
|
|
java.net.URL
|
2
|
112
|
|
java.net.URLClassLoader$1
|
2
|
32
|
|
java.security.PrivilegedActionException
|
2
|
64
|
|
java.util.ArrayList
|
2
|
48
|
|
java.io.FileDescriptor
|
1
|
24
|
|
java.io.FileInputStream
|
1
|
16
|
|
java.io.FilePermission
|
1
|
32
|
|
java.io.FilePermission$1
|
1
|
16
|
|
java.io.FilePermissionCollection
|
1
|
16
|
|
java.lang.Class
|
1
|
88
|
Problem 3: so are there any memory leaks ?
Supposing you make an heavy use of the HttpSession to store your Objects. Have you forgot maybe to remove unused objects from the Session ? it can be….let’s see….choose the “Memory” menu and select the only available snapshot.
Here you’ll see really lots of data, but we’re interested mainly on our “Car” Object…..searching through the table we find, besides the CarDAO which is istantiated just 1 time, the Car Bean which is created 1000 times.
| Leaks | Creations | Threads | profile.dao.CarDAO | 1 | 8 | 1 | 8 |
| Leaks | Creations | Threads | profile.pojo.Car | 1000 | 32000 | 0 | 0 |
Clicking on Leaks you’ll discover that:
Methods tha keeped instances of “profile.pojo.Car” Alive
| Method | Instances |
| findCars | 1000 |
Actually you have in memory 1000 instances of the “Car” object. As a matter of fact in the jsp search page we have put in memory the whole Car arraylist
<%
CarDAO dao = new CarDAO();
ArrayList list = dao.findCars();
session.setAttribute(“cars”,list);
%>
Conclusion
This article provides an introduction to JBoss Profiler showing which are the first steps in profiling an application.Profiling an application car require lots of time and skilled persons so you’ll seldom need to search for every minimal Memory Leak in you application: anyway setting up a basic session of Profiling is quite simple with this tool and in most cases it would be enough to know which are the killer methods of the program which need optimization or the Object which are retained in memory at a certain time.
Found the article helpful? if so please follow us on Socials