Health checks are an essential component of all microservices applications. In this tutorial we will learn how to use the HealthCheck Microprofile API to verify the liveness and readiness of a Microservice along with the new Startup check which is available since the MP Health version 3.1.
When using Microservices, it’s fundamental to be able to automatically check if they are up
and running. A way to do this is to expose some endpoints for each service so we can
check its state. That’s exactly the purpose of MicroProfile Health API.
You can add checks to your Microservices by annotations. The annotations used are under the package org.eclipse.microprofile.health package and you can use them to perform the following checks:
- Liveness check: you can use them for services that run for long periods of time, which may eventually transit to a broken state. Therefore, it cannot recover except being restarted.
- Readiness check: you can use them for services that
temporarily cannot serve traffic. For example, a service might need to load large data or configuration files during startup.
- Startup check: this is the last addition and you can use it as start up probe of your Microservice.
Let’s see a practical example of it. We will create a simple JAX-RS application and then we will deploy it on a runtime which is compatible with MicroProfile API (f.e. WildFly, JBoss EAP or Quarkus).
Coding a MicroProfile Health application
Let’s create our first Health check. Firstly, we will add the @Startup annotation to a CDI Bean which returns a simple ack when the application starts:
@Startup

@ApplicationScoped
public class SimpleHealthCheck implements HealthCheck {

    @Override
    public HealthCheckResponse call() {
    	return HealthCheckResponse.named("Application started").up().build();
    }
}
Next, we will code a Liveness check to verify that our application is still meeting the Memory requirements:
@Liveness
@ApplicationScoped
public class OSHealthCheck implements HealthCheck {

    @Inject
    @ConfigProperty(name = "freememory.threshold", defaultValue = "10485760")
    private long threshold;

    @Override
    public HealthCheckResponse call() {
        HealthCheckResponseBuilder responseBuilder = HealthCheckResponse.named("MemoryHealthCheck Liveness check");
        long freeMemory = Runtime.getRuntime().freeMemory();
        if (freeMemory >= threshold) {
            responseBuilder.up();
        } else {
            responseBuilder.down().withData("error",
                    "Not enough free memory! Available " + freeMemory + "Please restart application");
        }
        return responseBuilder.build();
    }
}
The freememory.threashold is defined in the application.properties file, although a default value for it is available:
freememory.threshold=10485760
Finally, our last HealthCheck is a Readiness check which checks if an external resource (the Database) is available. For this purpose we use Microprofile configuration variables which have a default value in standalone environment. When running on OpenShift, the environment variables are injected into the Pod as soon as the PostgreSQL database is running:
@Readiness
@ApplicationScoped
public class DatabaseHealthCheck implements HealthCheck {

  @Inject
  @ConfigProperty(name = "POSTGRESQL_SERVICE_HOST", defaultValue = "localhost")
  private String host;

  @Inject
  @ConfigProperty(name = "POSTGRESQL_SERVICE_PORT", defaultValue = "5432")
  private int port;

  @Override
  public HealthCheckResponse call() {

    HealthCheckResponseBuilder responseBuilder = HealthCheckResponse.named("Database connection health check");

    try {
      pingServer(host, port);
      responseBuilder.up();
    } catch (Exception e) {

      responseBuilder.down()
        .withData("error", e.getMessage());
    }

    return responseBuilder.build();
  }

  private void pingServer(String dbhost, int port) throws IOException {
    Socket socket = new Socket(dbhost, port);
    socket.close();

  }

}
Running the Microservice on WildFly
To run the Health checks on WildFly, it is required to add both Microprofile and Jakarta EE dependencies in your project:
<dependencyManagement>
    <dependencies>
        <dependency>
            <groupId>org.wildfly.bom</groupId>
            <artifactId>wildfly-microprofile</artifactId>
            <version>${version.microprofile.bom}</version>
            <type>pom</type>
            <scope>import</scope>
        </dependency>

    </dependencies>
</dependencyManagement>

<dependencies>
    <dependency>
        <groupId>org.eclipse.microprofile.health</groupId>
        <artifactId>microprofile-health-api</artifactId>
        <scope>provided</scope>
    </dependency>


    <dependency>
        <groupId>org.eclipse.microprofile.config</groupId>
        <artifactId>microprofile-config-api</artifactId>
    </dependency>


    <dependency>
        <groupId>jakarta.platform</groupId>
        <artifactId>jakarta.jakartaee-api</artifactId>
        <version>8.0.0</version>
        <scope>provided</scope>
    </dependency>
</dependencies>
Also, we need a configuration profile which includes the following subsystems:
For example, you can run the standalone-microprofile.xml :
$ standalone.sh -c standalone-microprofile.xml
Then, deploy the application on WildFly:
$ mvn install wildfly:deploy
If you prefer, our sample application also includes WildFly Maven Bootable Jar plugin. To run it as Bootable Jar you need just one command:
$ mvn install wildfly-jar:run
To query the health checks, we can use the following endpoints:
/health/started– To check startup probes./health/live– To check liveness probes./health/ready– To check readiness probes./health– Accumulating all health check procedures in the application.
Let’s check at first the started endpoint:
curl -s http://localhost:9990/health/started | jq
{
  "status": "UP",
  "checks": [
    {
      "name": "Application started",
      "status": "UP"
    }
  ]
}
The liveness endpoint:
curl -s http://localhost:9990/health/live | jq
{
  "status": "UP",
  "checks": [
    {
      "name": "MemoryHealthCheck Liveness check",
      "status": "UP"
    }
  ]
}
And finally, the readiness endpoint:
{
  "status": "DOWN",
  "checks": [
    {
      "name": "deployments-status",
      "status": "UP",
      "data": {
        "microprofile-health.war": "OK"
      }
    },
    {
      "name": "server-state",
      "status": "UP",
      "data": {
        "value": "running"
      }
    },
    {
      "name": "boot-errors",
      "status": "UP"
    },
    {
      "name": "Database connection health check",
      "status": "DOWN",
      "data": {
        "error": "Connection refused (Connection refused)"
      }
    }
  ]
}
As you can see, a failure has been reported as the Connection to the Database failed. That’s correct. let’s fix it:
docker run --rm=true --name health_test -e POSTGRES_USER=admin -e POSTGRES_PASSWORD=mypassword123 -e POSTGRES_DB=postgresdb -p 5432:5432 postgres
Now let’s run again the health check:
{
  "status": "UP",
  "checks": [
    {
      "name": "deployments-status",
      "status": "UP",
      "data": {
        "microprofile-health.war": "OK"
      }
    },
    {
      "name": "server-state",
      "status": "UP",
      "data": {
        "value": "running"
      }
    },
    {
      "name": "boot-errors",
      "status": "UP"
    },
    {
      "name": "Database connection health check",
      "status": "UP"
    }
  ]
}
As you can see, the readiness endpoint reports a successful connection to the Database. Also notice some default Health checks are there including the server-state, boot-errors and the deployment-status of the application.
Great! the Health check application works. Let’s see how it works in the Cloud.
Taking the example to the Cloud
So now we have got an application which contains an Health check. Let’s see how we can use Containers Health Check on Openshift to verify the status of the application. Start your Openshift/OKD Environment and create a new project:
$ oc new-app health-demo
We will add a PostgreSQL Database using the “postgresql” Template and providing a minimal configuration through Environment Variables:
$ oc new-app -e POSTGRESQL_USER=postgres -e POSTGRESQL_PASSWORD=postgres -e POSTGRESQL_DATABASE=postgresdb postgresql
Ok, now you should be able to see the following Pod available:
$ oc get pods
NAME                 READY     STATUS    RESTARTS   AGE
postgresql-1-lvl2w   1/1       Running   1          9s
Next, we will deploy our Health check application on Openshift. To do that, we recommend to wrap it in a Bootable Jar and use the openshift-maven-plugin to deploy it as follows:
mvn oc:deploy -Pbootable-jar-openshift
This is discussed in greater detail in this tutorial: How to deploy WildFly Bootable jar on OpenShift
Wait until the Pods are running:
oc get pods
NAME                              READY   STATUS      RESTARTS   AGE
microprofile-health-1-deploy      0/1     Completed   0          136m
microprofile-health-1-nscwz       1/1     Running     0          136m
microprofile-health-s2i-1-build   0/1     Completed   0          137m
postgresql-85b5b9bcc-5756g        1/1     Running     0          141m
Next, head to DeploymentConfigs > DeploymentConfigs details and Edit Health Checks

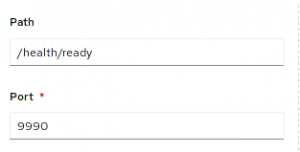
Within the Health Check details, you can verify that there’s already a valid Readiness check configuration with the defaults used by Microprofile API:
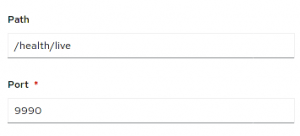
Liveness checks are ok as well:
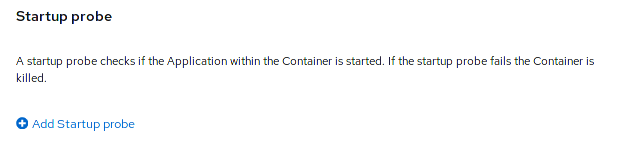
You may configure Startup probes, which are not on by default by clicking on the “Add Startup Probe” link:
Conclusion
We have discussed Microprofile health checks covering the aspects included in the latest release of Microprofile Health checks. Then, we have learnt how to configure Health Checks in the OpenShift environment.
The source code for this application is available here: https://github.com/fmarchioni/mastertheboss/tree/master/micro-services/mp-health-check
Found the article helpful? if so please follow us on Socials


