Wildfly 15 has been released. One of the enhancements contained in it is the enhanced set of metrics that are exposed by the application server so that they can be consumed by the Openshift Console
You can check the following health and metrics with WildFly 15:
Application Server health:
$ curl http://localhost:9990/health
{"outcome":"UP","checks":[]}
Application Server Metrics:
$ curl http://localhost:9990/metrics
# HELP base:classloader_total_loaded_class_count Displays the total number of classes that have been loaded since the Java virtual machine has started execution.
# TYPE base:classloader_total_loaded_class_count counter
base:classloader_total_loaded_class_count 23003.0
# HELP base:cpu_system_load_average Displays the system load average for the last minute. The system load average is the sum of the number of runnable entities queued to the available processors and the number of runnable entities running on the available processors averaged over a period of time. The way in which the load average is calculated is operating system specific but is typically a damped time-dependent average. If the load average is not available, a negative value is displayed. This attribute is designed to provide a hint about the system load and may be queried frequently. The load average may be unavailable on some platform where it is expensive to implement this method.
# TYPE base:cpu_system_load_average gauge
base:cpu_system_load_average 3.16
# HELP base:thread_count Number of currently deployed threads
# TYPE base:thread_count counter
base:thread_count 62.0
# HELP base:classloader_current_loaded_class_count Displays the number of classes that are currently loaded in the Java virtual machine.
# TYPE base:classloader_current_loaded_class_count counter
base:classloader_current_loaded_class_count 22998.0
# HELP base:jvm_uptime_seconds Displays the uptime of the Java virtual machine
# TYPE base:jvm_uptime_seconds gauge
base:jvm_uptime_seconds 641.066
# HELP base:memory_committed_non_heap_bytes Displays the amount of memory that is committed for the Java virtual machine to use.
# TYPE base:memory_committed_non_heap_bytes gauge
base:memory_committed_non_heap_bytes 1.73408256E8
# HELP base:gc_ps_mark_sweep_count Displays the total number of collections that have occurred. This attribute lists -1 if the collection count is undefined for this collector.
# TYPE base:gc_ps_mark_sweep_count counter
base:gc_ps_mark_sweep_count 2.0
# HELP base:memory_committed_heap_bytes Displays the amount of memory that is committed for the Java virtual machine to use.
# TYPE base:memory_committed_heap_bytes gauge
base:memory_committed_heap_bytes 2.41696768E8
# HELP base:thread_max_count Displays the peak live thread count since the Java virtual machine started or peak was reset. This includes daemon and non-daemon threads.
# TYPE base:thread_max_count counter
base:thread_max_count 124.0
# HELP base:gc_ps_scavenge_count Displays the total number of collections that have occurred. This attribute lists -1 if the collection count is undefined for this collector.
# TYPE base:gc_ps_scavenge_count counter
base:gc_ps_scavenge_count 14.0
# HELP base:cpu_available_processors Displays the number of processors available to the Java virtual machine. This value may change during a particular invocation of the virtual machine.
# TYPE base:cpu_available_processors gauge
base:cpu_available_processors 4.0
# HELP base:thread_daemon_count Displays the current number of live daemon threads.
# TYPE base:thread_daemon_count counter
base:thread_daemon_count 16.0
# HELP base:classloader_total_unloaded_class_count Displays the total number of classes unloaded since the Java virtual machine has started execution.
# TYPE base:classloader_total_unloaded_class_count counter
base:classloader_total_unloaded_class_count 5.0
# HELP base:memory_used_non_heap_bytes Displays the amount of used memory.
# TYPE base:memory_used_non_heap_bytes gauge
base:memory_used_non_heap_bytes 1.56871512E8
# HELP base:memory_max_heap_bytes Displays the maximum amount of memory in bytes that can be used for memory management.
# TYPE base:memory_max_heap_bytes gauge
base:memory_max_heap_bytes 4.77626368E8
# HELP base:cpu_process_cpu_load Displays the "recent cpu usage" for the Java Virtual Machine process.
# TYPE base:cpu_process_cpu_load gauge
base:cpu_process_cpu_load 0.019183247606670208
# HELP base:memory_used_heap_bytes Displays the amount of used memory.
# TYPE base:memory_used_heap_bytes gauge
base:memory_used_heap_bytes 1.16290568E8
As you can see from the above text, the HTTP endpoint exposes the following metrics:
- Base: metrics – Required metrics specified in the MicroProfile 1.1 specification are exposed in the `base` scope.
- Vendor: metrics – Metrics from WildFly subsystems are exposed in the `vendor` scope
- Application: metrics – Metrics from the application and from the deployment’s subsystems are exposed in the `application` scope.
The application server by default exposes its metrics for all subsystems. This is configured through the exposed-subsystem attribute of the microprofile-metrics-smallrye subsystem:
/subsystem=microprofile-metrics-smallrye:read-attribute(name=exposed-subsystems)
{
    "outcome" => "success",
    "result" => ["*"]
}
By default, the metrics can be accessed without authentication, as the security-enabled attribute is set to false:
/subsystem=microprofile-metrics-smallrye:read-resource(include-runtime=true)
{
    "outcome" => "success",
    "result" => {
        "exposed-subsystems" => ["*"],
        "security-enabled" => false
    }
}
In order to request authentication, you have to set the security-enabled attribute to true:
/subsystem=microprofile-metrics-smallrye:write-attribute(name=security-enabled,value=true)
Exposing metrics to Openshift
As you have available the application server Metrics, they can be consumed by OpenShift Console. There are several strategies to do that but, according to the open JIRAs (e.g. https://issues.jboss.org/browse/WFLY-10712), these metrics will be eventually consumed by the Kiali console, when the Prometheus agent is active. Here is a picture that describes the overall architecture:
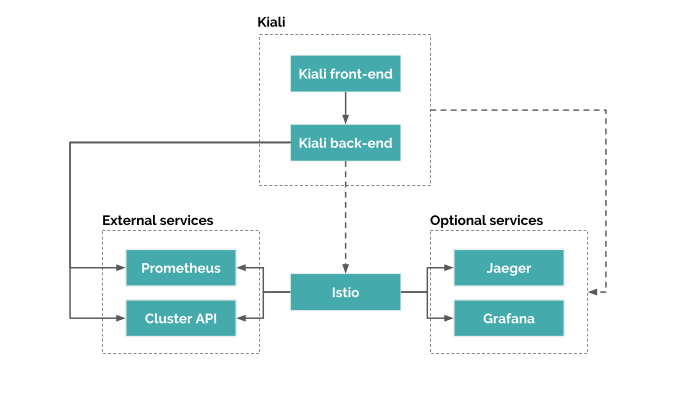
In a nutshell, Kiali is composed of two components: a back-end application running in the container application platform like Openshift, and a front-end application. Moreover, Kiali depends on external services and components provided by the container application platform and Istio.
The core components ok Kiali are:
- Istio which is a Kiali requirement. It’s the component that provides and controls the service mesh. Although Kiali and Istio can be installed separately, Kiali depends on Istio and won’t work if it’s not present.
- Prometheus is, in turn, an Istio dependency. When Istio is enabled, metrics data is stored in Prometheus. Kiali uses the data stored in Prometheus to figure out the mesh topology, show metrics, calculate health, show possible problems, etc.
- Cluster API: Kiali uses the API of the container application platform like Openshift to fetch and resolve service mesh configurations.
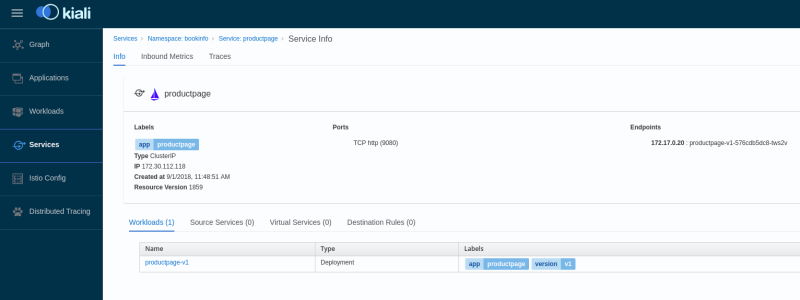
If you want to have a quick look at Kiali with Openshuft, you can try to run the convenience script cluster-openshift.sh which will install OpenShift, Istio, and Kiali all at once:
wget https://raw.githubusercontent.com/kiali/kiali/master/hack/cluster-openshift.sh

sh cluster-openshift.sh --kiali-enabled true up
This command installs an OpenShift cluster with Maistra and Kiali as depicted by the following picture:
Continue learning in the following tutorial: Monitoring WildFly with Prometheus
Found the article helpful? if so please follow us on Socials


