WildFly uses Undertow as Web server. In order to configure the amount of threads available in a Web application, we can define a Worker Thread from the io subsystem and use the Worker Thread for its HTTP listeners or just for single applications. In this tutorial we will learn how to do it.
Overview of the IO subsystem
Out of the box, the io subsystem provides a default worker Thread that Undertow uses for HTTP Requests:
/subsystem=io:read-resource
{
    "outcome" => "success",
    "result" => {
        "buffer-pool" => {"default" => undefined},
        "worker" => {
            "default" => undefined
        }
    }
}
We change the attributes for the default worker or simply define a new worker as in this example:
/subsystem=io/worker=largeworker/:add(io-threads=10,stack-size=0,task-keepalive=60,task-max-threads=100)
The above command defines a worker “largerworker” with the “io-threads” set to 10, and the “task-max-threads” set to 100
Now in order to use this worker on the default http listener, we need a batch script that sets the same worker for the remoting worker attribute:
batch

/subsystem=undertow/server=default-server/http-listener=default/:write-attribute(name=worker,value=largeworker)

/subsystem=remoting:write-attribute(name=worker,value=largeworker)

run-batch
Since http-upgrade is enabled by default, the remoting and the http-listener worker must use the same worker Thread.
The above command needs a reload in your server configuration to take effect.
Setting the Worker thread in the deployment descriptor
On the other hand, we can also use a specific worker at application level. This can be done through the jboss-web.xml configuration file which includes an executor-name element:
<jboss-web>
  <executor-name>largeworker</executor-name>
</jboss-web>
Once you deploy the application using the above executor, the Web server will use the custom worker Threads for your application.
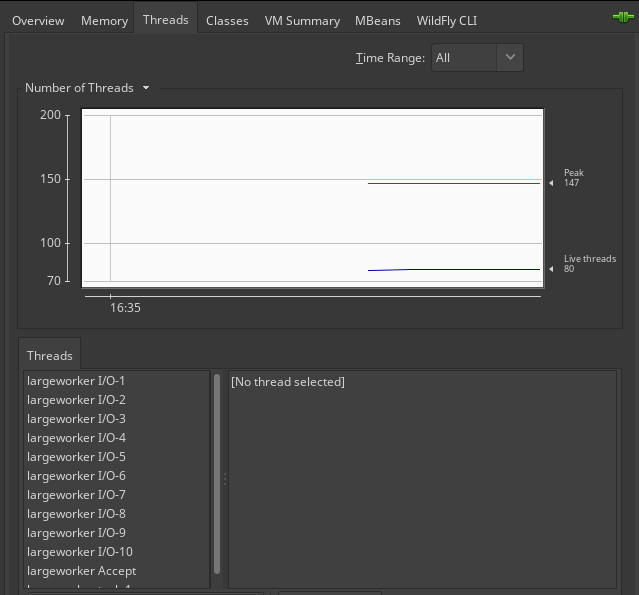
The Thread name follows this criteria: [worker name]-[worker id]. You can monitor the Thread pool using any tool like the JConsole utility (included as part of the JDK standard edition) that allows printing a dump of the Threads stack traces running in a JVM. Here is a dump of our worker pool:
