This tutorial has been written for an old version of JBoss AS 5. At the bottom of it, you will find how to collect snapshots with JBoss 5 from the JMX-Console.
If you are running WildFly or JBoss EAP 7, we recommend the following updated resources:
- Monitoring Enterprise applications with OpenShift and Prometheus
- Monitoring WildFly with Prometheus
- Using Prometheus and Grafana to capture Alerts and visualize Metrics
- Using ELK stack to collect WildFly / JBoss EAP metrics
Collecting JBoss AS Snapshots
JBoss gives you the ability to capture data not only in real time but also over regular intervals.
You can start or stop the data collection process according to your needs. Then you can return later to analyze the collected values.
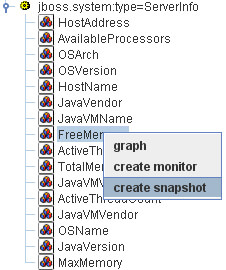
To create a snapshot open the Web Console and point to the JMX MBean you want to monitor.
Then choose the Create Snapshot menu item on the specific attribute you want to monitor.
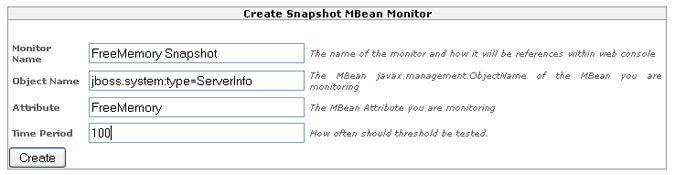
You’ll be presented with a simple configuration form. You only need to enter the measurement time
period. This is the time between measurements, in milliseconds. To monitor the value every 100ms enter 100 in the corresponding text field and click the Create button.
To start the snapshot of memory usage, click the Start Snapshot button.
Wait a few seconds for JBoss to collect measurements. Now you should see your snapshot available in the upper Monitoring Menu:

Ok, now click on the Snapshot : you might analyze it graphically or display the collected data.
The Graph Dataset button will give you a graph like the one shown in.
Notice that the graph isn’t a live graph. It’s a fixed graph of the data collected up to that point. This graph will give you a good idea of what happened over the specified time period. If you need better analysis capabilities, click Show Dataset, which displays all the collected data. You can select the data in the dataset view, and copy and paste it to an application such as Excel that can perform more sophisticated numerical analysis.
Found the article helpful? if so please follow us on Socials


