Are your Java threads consuming most of your CPU and want to find which one is actually consuming most of it? Then just keep reading.
There are several solutions to detect which Java thread is consuming more CPU.
Use JVisualVM to find CPU consuming threads
If you have installed JVisualVM, then you can connect to the remote machine and view the CPU utilization, memory sampling, threads.
In the Thread CPU Time sub-panel you can view how much CPU time is being spent by each thread. This allows you to inspect CPU time since the sampling started (Thread CPU Time [ms]) and instantly (Thread CPU Time [ms/sec], on the far right).
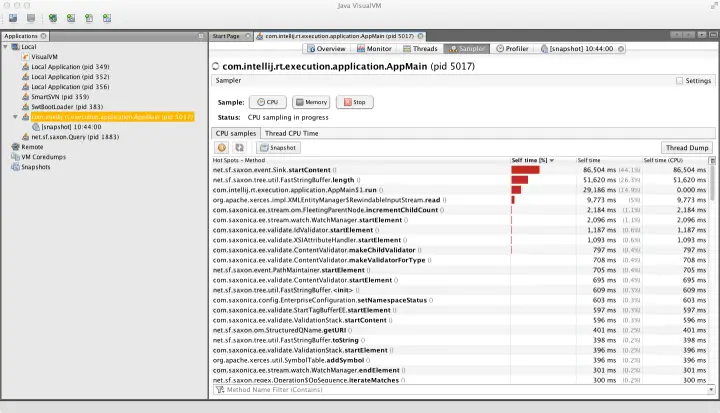
The advantage of this solution is that you can monitor in real time which method is consuming more CPU (by the way, you can monitor also Memory usage with the same tool).
On the other hand, JVisualVM often requires a fairly high amount of memory/CPU to be run and its agent can further hog the CPU where the Java process is running.
Use the jstack command to find CPU consuming threads
If you have nothing but the command line don’t panic! We will learn how to find which Java Thread is hogging your CPU in a minute with the built-in tool jstack.
When you issue the jstack command with the -l parameter you will collect the Thread dump for a process with the amount of CPU used (in ms).
Firstly, you need to find the PID of your Java process. There are multiple ways, for example, you can use the jps command which is built-in with JDK:
$ jps -v | grep -v Jps

5213 jboss-modules.jar -D[Standalone] -Xms64m -Xmx512m -XX:MetaspaceSize=96M -XX:MaxMetaspaceSize=256m -Djava.net.preferIPv4Stack=true -
Next, capture a Thread dump for the PID 5213:
jstack -l 5213 | grep cpu

"Reference Handler" #2 daemon prio=10 os_prio=0 cpu=2.76ms elapsed=7027.22s tid=0x00000000013bb800 nid=0x1465 waiting on condition  [0x00007f386cc0c000]
"Finalizer" #3 daemon prio=8 os_prio=0 cpu=1.30ms elapsed=7027.22s tid=0x00000000013c6000 nid=0x1466 in Object.wait()  [0x00007f386cb0b000]
"Signal Dispatcher" #4 daemon prio=9 os_prio=0 cpu=0.31ms elapsed=7027.21s tid=0x00000000013db000 nid=0x1467 runnable  [0x0000000000000000]
"C2 CompilerThread0" #5 daemon prio=9 os_prio=0 cpu=6033.64ms elapsed=7027.21s tid=0x00000000013dd800 nid=0x1468 waiting on condition  [0x0000000000000000]
"C1 CompilerThread0" #8 daemon prio=9 os_prio=0 cpu=2371.86ms elapsed=7027.21s tid=0x00000000013e0000 nid=0x1469 waiting on condition  [0x0000000000000000]
. . . .
As you can see, along with the Thread name you will find the CPU usage in ms.
Finally, with some awk and sort hacks, you can even get the list of threads ordered by CPU usage!
jstack -l 5213 | grep cpu | awk 'match($0, /cpu=[[:digit:].]+/){print substr($0, RSTART+4, RLENGTH-1)+0, $0}' | sort -n -k1,1 | cut -d' ' -f2-
Use the top command to find CPU consuming threads
Lastly, you can also use the top command to find CPU usage of a Java process.
As usual, you need to detect first the PID of the Java process:
$ jps -v
11218 Jps -Dapplication.home=/usr/lib/jvm/java-1.8.0-openjdk-1.8.0.191.b13-0.fc29.x86_64 -Xms8m
10824 jboss-modules.jar -D[Standalone] -Xms64m -Xmx512m -XX:MetaspaceSize=96M -XX:MaxMetaspaceSize=256m -Djava.net.preferIPv4Stack=true -Djboss.modules.system.pkgs=org.jboss.byteman -Djava.awt.headless=true -Dorg.jboss.boot.log.file=/home/francesco/jboss/wildfly-19.0.0.Final/standalone/log/server.log -Dlogging.configuration=file:/home/francesco/jboss/wildfly-19.0.0.Final/standalone/configuration/logging.properties
So we have a WildFly server running with process id 11218. Now we will use the top utility to detect which Java thread is consuming most of the CPU:
Then, you can use the top command against our Java process (11218) as follows:
$ top -n 1 -H -p 11218
Please notice we are using the -H option (Threads toggle). When this toggle is On, all individual threads will be displayed. Otherwise, top displays a summation of all threads in a process.
On Solaris, you can use the prstat command:
$ prstat -L -p 11218
Now the twist is that the Thread id used by Java Thread dumps uses an Hex notation for Threads’ id. Don’t panic, let’s use the printf function to calculate the Hex notation for our pid:
 $ printf 0x%x 10841
 0x2a59
As you will see, the process id of the light weight process (0x2a59) corresponds to the nid attribute of Java Thread dump. So here’s how to find the related Thread which is causing your CPU to slow down:
$ jstack -l 11218 | grep "0x2a59"
"default I/O-7" #95 prio=5 os_prio=0 tid=0x00007fe714151000 nid=0x2c4c runnable [0x00007fe6d79f8000]
So there’s some I/O processing in the Thread which is consuming lots of CPI. Further inspection of this Thread’s Stack trace will help you to get closer to the solution of the problem.
Programmatically find which Thread is consuming your CPU
If you prefer a programmatic approach to finding the CPU usage of threads, then you can have a look at the java.lang.management.ThreadMXBean class, which is part of the JMX management API. How to use this class in the context of the application server is discussed in detail in the “Hacking JMX ” section of this book. In a nutshell, once you have collected the ThreadMXBean from the ManagementFactory:
ThreadMXBean tmxb = ManagementFactory.getThreadMXBean();

// Then you can query how much a specific thread is consuming by using:

long cpuTime = tmxb.getThreadCpuTime(aThreadID);
Use jvmtop to find which thread is consuming your CPU
jvmtop is a lightweight console application to monitor all accessible, running jvms on a machine. In a top-like manner, it displays JVM internal metrics (e.g. memory information) of running java processes. Jvmtop does also include a CPU console profiler.
You can find the project here: https://github.com/patric-r/jvmtop
Once run, you can easily capture the list of threads which are hogging your CPU. Example output:
jvmtop.sh <pid>
JvmTop 0.4.1 alpha   amd64,  4 cpus, Linux 2.6.18-34

 PID 3539: org.apache.catalina.startup.Bootstrap
 ARGS: start
 VMARGS: -Djava.util.logging.config.file=/home/webserver/apache-tomcat-5.5[...]
 VM: Sun Microsystems Inc. Java HotSpot(TM) 64-Bit Server VM 1.6.0_25
 UP: 869:33m #THR: 106  #THRPEAK: 143  #THRCREATED: 128020 USER: webserver
 CPU:  4.55% GC:  3.25% HEAP: 137m / 227m NONHEAP:  75m / 304m
 Note: Only top 10 threads (according cpu load) are shown!

  TID   NAME                                    STATE    CPU  TOTALCPU BLOCKEDBY
     25 http-8080-Processor13                RUNNABLE  4.55%     1.60%
 128022 RMI TCP Connection(18)-10.101.       RUNNABLE  1.82%     0.02%
  36578 http-8080-Processor164               RUNNABLE  0.91%     2.35%
  36453 http-8080-Processor94                RUNNABLE  0.91%     1.52%
     27 http-8080-Processor15                RUNNABLE  0.91%     1.81%
     14 http-8080-Processor2                 RUNNABLE  0.91%     3.17%
 128026 JMX server connection timeout   TIMED_WAITING  0.00%     0.00%
 128025 JMX server connection timeout   TIMED_WAITING  0.00%     0.00%
 128024 JMX server connection timeout   TIMED_WAITING  0.00%     0.00%
 128023 JMX server connection timeout   TIMED_WAITING  0.00%     0.00%
Summary
We have just covered some handy solutions to detect which Java process most of the CPU on a Linux/Unix system.
Found the article helpful? if so please follow us on Socials


