In this tutorial we will learn which options can be used to monitor the CPU usage of JBoss / WildFly threads. CPU monitoring can be done in several ways, we however recommend using a free tool like JVisualVM or JConsole to collect this data.
Monitoring WildFly CPU usage with JVisualVM
VisualVM is a free tool which was once bundled with the JDK. Now it can be downloaded separately.
Read more about VisualVM installation in this tutorial: Monitoring WildFly using VisualVM
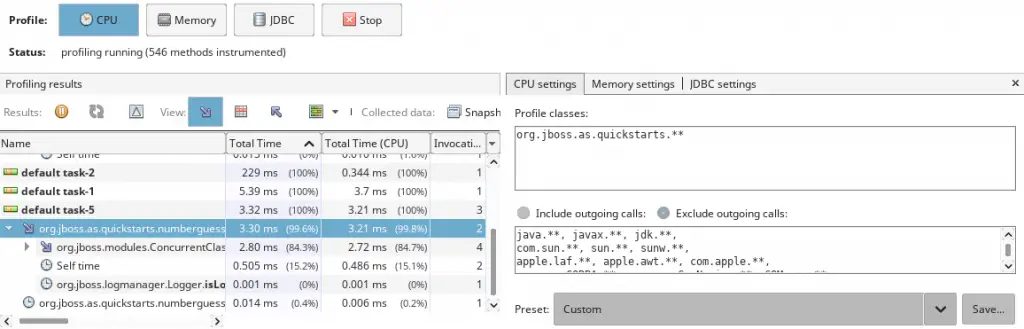
To monitor WildFly CPU usage we recommend using the Profiler tool. The Profile tool returns detailed data on method-level CPU performance (execution time), showing the total execution time the and number of invocations for each method. When analyzing application performance, Java VisualVM instruments all of the methods of the profiled application. Threads emit the “method entry” event when entering a method and generate the corresponding “method exit” event when exiting the method. Both of these events contain timestamps. This data is processed in real time.
To get a reasonable profiling data, you should define which classes or packages are instrumented. You can also include or exclude outgoing calls.
Here is a screenshot of the Profiler tab showing CPU profiling results:
Monitoring WildFly CPU usage with JConsole
JBoss EAP and WildFly users can use JConsole in order to monitor the usage of the application server.
Start the JConsole shell bundled in WildFly:
$ bin/jconsole.sh
Now from the MBeans Tab select the java.lang.Threading folder:
See the following snapshot:
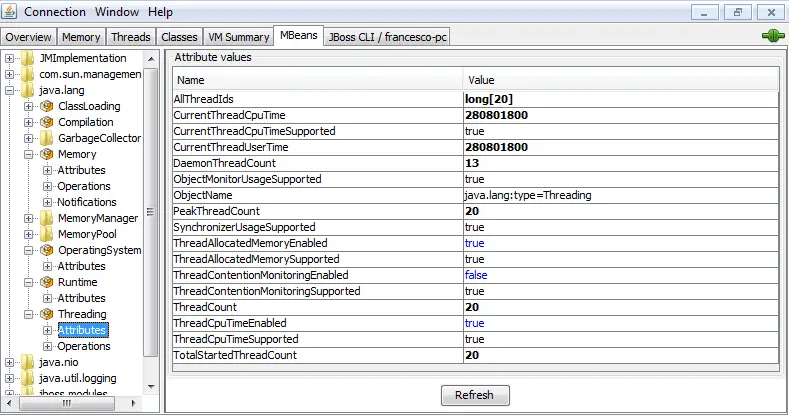
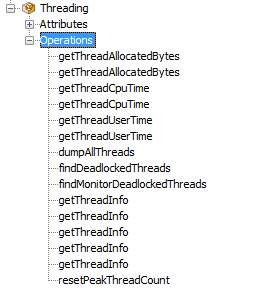
Within that folder, you can run operations such as getThreadCpuTime(Thread) to gather information for a particular thread:
JBoss AS 4/5/6 users
If you want to inspect jBoss Thread CPU’s usage you have a shortcut from the jmx-console. Point at the Mbean ServerInfo under the domain jboss.system.
This is a shortcut if you’re running your server on localhost:
http://localhost:8080/jmx-console/HtmlAdaptor?action=inspectMBean&name=jboss.system%3Atype%3DServerInfo
now invoke the operation listThreadCpuUtilization()
| Thread Name | CPU (milliseconds) |
|---|---|
| http-127.0.0.1-8080-1 | 609 |
| ScannerThread | 500 |
| DestroyJavaVM | 125 |
| DefaultQuartzScheduler_QuartzSchedulerThread | 78 |
| ContainerBackgroundProcessor[StandardEngine[jboss.web]] | 15 |
| DefaultQuartzScheduler_Worker-1 | 15 |
| DefaultQuartzScheduler_Worker-5 | 15 |
| Thread-4 | 15 |
Here you can see which threads are pumping the cpu – have a look, besides the threads dedicated to the web applications (running on port 8080) you are using quite a lof of cpu for the ScannerThread which is responsible of period based scanning for the Deployment of applications.
Found the article helpful? if so please follow us on Socials


