I have updated this tutorial to show how to use the hawtio console as opensource monitoring solution for any JVM middleware, like JBoss Enterprise applicaiton server / WildFly or any Java process which exposes metrics via JMX
Most of you would argue why we need to learn another management console, when we are just fine with the application server web console. Well, the advantage of using hawtio is evident if you have multiple middleware (maybe not homogeneous middleware) in your company: as a matter of fact hawtio is an opensource pluggable management console for Java stuff which can be used across any kind of Java technology and middleware (JBoss, Infinispan, AMQ, Red Hat Fuse, etc) . So, in a nutshell, you can have multiple middleware managed from a single point.
To make things easier hawtio also use Jolokia that exposes JMX with JSON over HTTP. This makes it pretty easy to hook frameworks even if they don’t already provide a rest interface, but expose things over JMX.
Deploying Hawtio on WildFly or JBoss EAP
In this paragraph we will show how to install the hawtio library to monitor both JBoss EAP and WildFly. As first step download the latest release of the hawtio-wildfly.2.X.war which is available at: https://github.com/hawtio/hawtio/releases/ .
Once downloaded, you can rename it for your convenience to hawtio.war and deploy into your application server.
cp hawtio.war $JBOSS_HOME/standalone/deployments
Next, you will need to add an user which belongs to the “hawtioadmin” Group.
./add-user.sh

What type of user do you wish to add?
 a) Management User (mgmt-users.properties)
 b) Application User (application-users.properties)
(a): b

Enter the details of the new user to add.
Using realm 'ApplicationRealm' as discovered from the existing property files.
Username : hawtioadmin
Password recommendations are listed below. To modify these restrictions edit the add-user.properties configuration file.
 - The password should be different from the username
 - The password should not be one of the following restricted values {root, admin, administrator}
 - The password should contain at least 8 characters, 1 alphabetic character(s), 1 digit(s), 1 non-alphanumeric symbol(s)
Password :
Re-enter Password :
What groups do you want this user to belong to? (Please enter a comma separated list, or leave blank for none)[  ]: hawtioadmin
About to add user 'hawtioadmin' for realm 'ApplicationRealm'
Is this correct yes/no? yes
Now simply open the browser at the Web context of hawtio, for example http://localhost:8080/hawtio
You will be requested to enter the Username and Password.
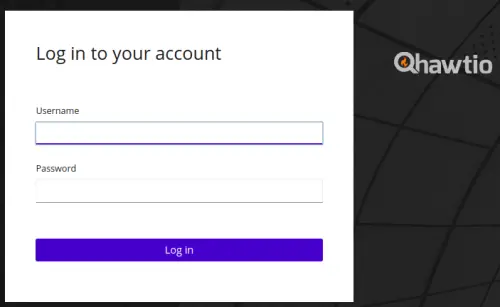
Use the one we have just added and you will be granted access. As you can see, the screen is divided into several tabs, depending on the plugins detected. For example, let’s dig into the JMX Section which contains all the available MBeans:
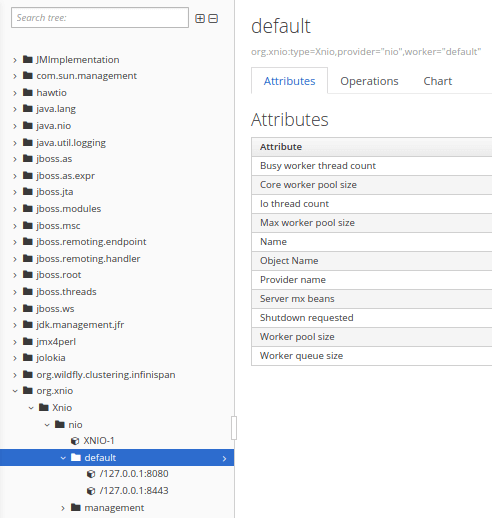
One really nice thing is that you can click on the single JMX attributes and you will get the Jolokia REST URL to query for that attribute. So for example if we were to query the “Worker queue size” from the above picture, the following REST URL will be shown: http://localhost:8080/hawtio/jolokia/read/org.xnio:type=Xnio,provider=!%22nio!%22,worker=!%22default!%22/WorkerQueueSize
By entering it on a Browser URL, you would get the value of that attribute as JSON expression:
{"request":{"mbean":"org.xnio:provider=\"nio\",type=Xnio,worker=\"default\"","attribute":"WorkerQueueSize","type":"read"},"value":0,"timestamp":1602067530,"status":200}
Adding plugins
hawtio is highly modular with lots of plugins, so that hawtio can discover exactly what services are inside a JVM and dynamically update the console to provide an interface to them as things come and go. So after you have deployed hawtio into a container, as you add and remove new services to your JVM the hawtio console updates in real time.
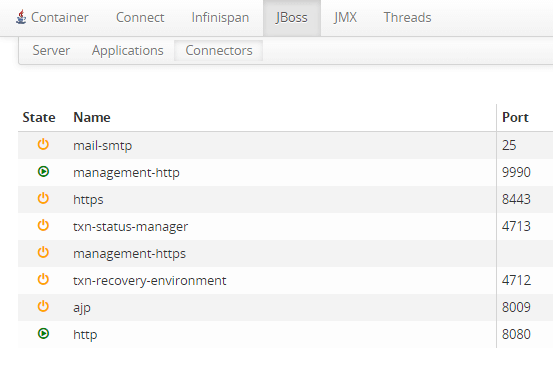
Since the plugin has been deployed on JBoss EAP, hawtio has detected the JBoss plugin which contains a set of three tabs:
- Server: Info about the server release
- Applications: Can be used to manage the applications deployed
- Connectors: shows the Socket bindings available on the server
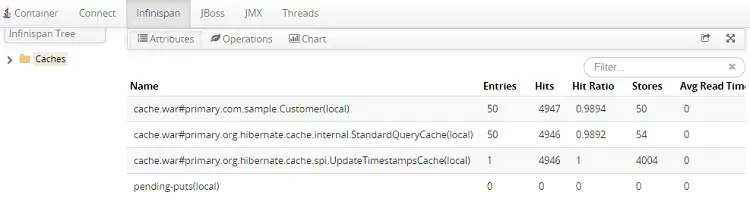
Let’s see another example: we have set the Infinispan hibernate cache to EAGER and deploying an application which uses the 2LC of Infinispan. By logging into hawtio we can have evidence of our caches, by selecting the Infinispan tab, which shows the statistics for the cache: