This article is whirlwind tour across the Java Flight Recorder (JFR) and the Java Mission Control (JMC) suite. At the end of it, you will be able to monitor, collect diagnostic data and profile any running Java application.
What is Java Flight Recorder?
Firstly, why do we need another tool to monitor Java ? As a matter of fact, there are already several options available to monitor Java applications. Many of you already know about VisualVM (see this article to learn more: Monitoring WildFly using VisualVM ) and JConsole (Using JConsole to monitor a remote WildFly server ).
JDK Flight Recorder is a performance/diagnostic tool that ships within the Java Virtual Machine (JVM) code. Formerly available as commercial feature of JRockit you can now run it in common OpenJDK distributions, such as OpenJDK 11.
What is the advantage of using JFR versus VisualVM/JConsole?
To some extent, Java Flight Recorder is similar to a typical Java profiler such as VisuaVM or JConsole. There are some advantages though.
- JFR ships with a coherent and richer data model that makes it easier to cross reference/filter diagnostic events.
- You can share the information from JFR with your support team to provide an unified view of your application data. This could be the equivalent (in OS terms) of a sosreport that you provide to the support team.
- JFR’s data gathering engine is well integrated into the HotSpot JVM, This means that JFR there will be less overhead to gather data. On the other hand, VisualVM or JConsole use external APIs/MXBeans to collect data.
How to enable JFR
The simplest way to activate the Java Flight Recorder consists in adding the the JVM option -XX:StartFlightRecording at start up. For example, if you want to add it to WildFly application server or JBoss EAP, include in the standalone.conf file this option:
JAVA_OPTS="$JAVA_OPTS -XX:StartFlightRecording=duration=200s,filename=record.jfr"
In the above command, we are recording data for 200 seconds in the file record.jfr.
On the other hand, you can also activate the JFR tool on a running Java process by using jcmd tool. You need to provide, besides the Process ID (PID), the action you want to execute.
To start a flight recording, use the JFR.start diagnostic command. For example, the following command starts a recording named monitor2hour that keeps data for a maximum of 2 hours, and limits the size of the recording to 250 megabytes.
$ jcmd pid JFR.start name=monitor2hour maxage=2h maxsize=250M
To write data to a file, while a flight recording is running, use the JFR.dump diagnostic command as follows:.
$ jcmd pid JFR.dump name=monitor2hour filename=monitor-dump.jfr
Finally, use the JFR.stop command to stop recording diagnostic data:
$ jcmd pid JFR.stop name=monitor2hour filename=debugrun1.jfr
How to enable Flight Recorder with JBang
JBang is a tool to create, edit and run self-contained source-only Java programs. You can read more about it here: JBang: Create Java scripts like a pro
You can apply the Flight Recorder on a JBang script as follows:
jbang --jfr application.java
By default –jfr will start flight recorder dump event recordings to the file application.jfr (therefore using base name of the script as its filename).
How to view data with Java Mission Control (JMC)
So far we have recorder diagnostic data with Java Flight Recorder. Next, we need to inspect this data. For this purpose you can use the Java Mission Control Tool (JMC) which is a suite of tools for OpenJDK/Oracle JDK .
You can find the JMC project on github: https://github.com/openjdk/jmc
On the other hand, some Operating Systems (such as RHEL 8) provide the jmc tool as part of their module streams. JMC is also included in the OpenJDK developer builds for Windows. In this article, I will show you how to install JMC on a Fedora machine in three simple steps:
// enable the copr repo
$ dnf copr enable almac/jmc8

// install jmc
$ sudo dnf install jmc
Then launch the jmc command to start Java Mission Control:
jmc
Once started, choose File | Open File to open your JFR file. The first stop is the Automated Analysis Results which contains a list of the top problems detected with the score for each problem (0 to 100):
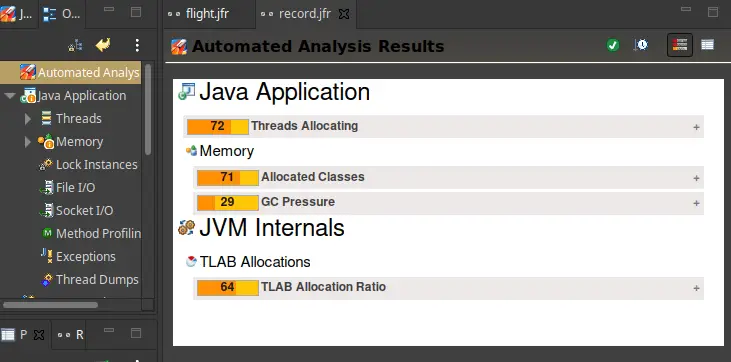
From this view, several problems are already evident:
- Threads Allocating: Many allocations performed by the same thread might indicate a problem in a multi-threaded program. Look at the stack traces for the thread with the highest allocation rate.
- Allocated Classes. Frequently allocated types are good places to start when trying to reduce garbage collections. Look at where the most common types are being allocated to see if many instances are created along the same call path.
- TLAB Allocation Ratio: The program allocated 98.9 % of the memory outside of TLABs. Allocating objects outside of Thread Local Allocation Buffers (TLABs) is more expensive than allocating inside TLABs.
These hot spots will be highlighted (with an orange “i” icon) within the Java Application tree.
The Java Mission Control Tree of resources
The left side of the JMC User Interface contains a set of metrics which are grouped in three main categories:
- Java Application: This branch is directly related to your application. From here you can pinpoint application Threads, profile methods, explore Exceptions and File or Socket I/O
- JVM Internals: This branch contains useful resources for Garbage collection analysis, Compilation and Classloading, VM Operations and TLAB Allocations.
- Environment: The last branch is your link to the OS Environment. Captures Processes, Environment Variables, System Properties and Native libraries.

Let’s get more in detail into the Java application branch.
Inside the Java Application
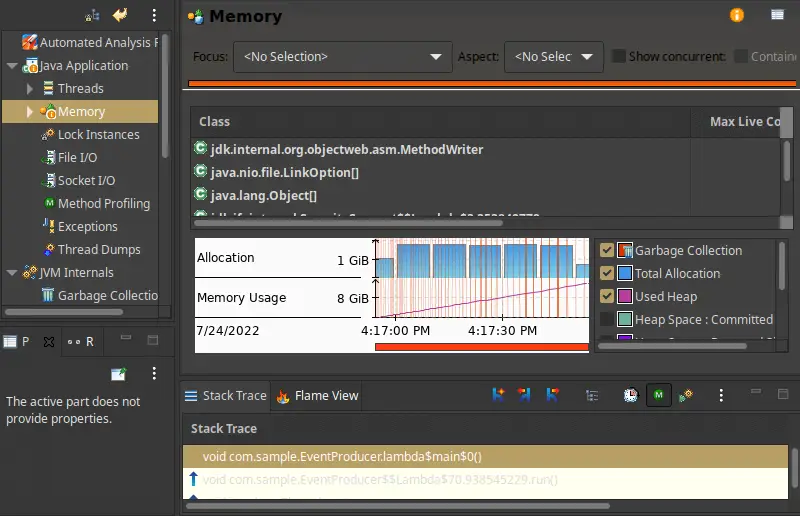
Within the Java Application tree view you will find a subset of all areas, including Threads, memory, Lock Instances, File I/O, Socket I/O, Method profiling, Exceptions and Thread Dumps.
As said, the subsets which have abnormal data show an (i) orange icon. For example, the Memory element shows a clear Memory Usage issue (a memory leak). In the Stack Trace lower tab you will be able to point to the offending method:
Another common profiling element is Method profiling: It will tell you where the hotspots are in your application’s methods. For example, if you have a CPU-bound problem, the method profiling information will tell you where to optimize to get things to go faster.
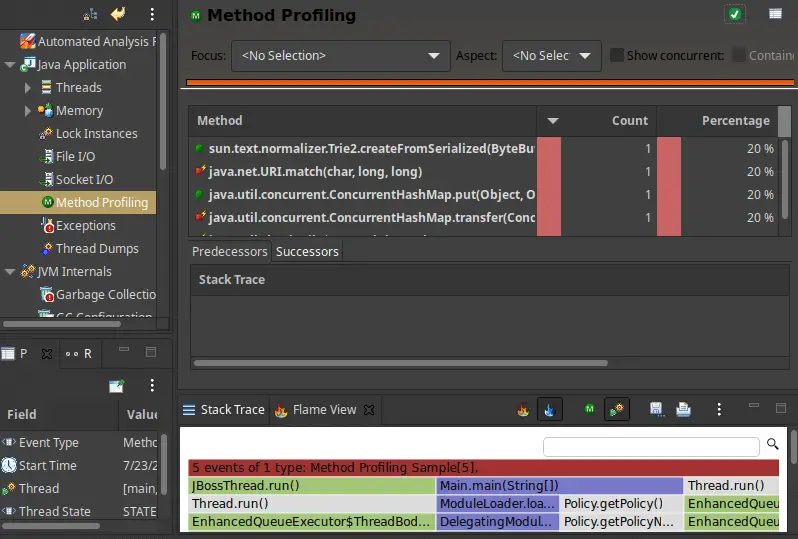
In the lower part of this UI you will find the Stack Trace and the Flame View of each single event.
A Flame View provides faster comprehension and reduced time for root cause analysis. Here is how read it:
- Each box in this view represents a method call.
- The x-axis shows the stack trace collection and the y-axis shows the stack depth.
- The width of the box indicates the frequency of function occurrences. Wider boxes mean more occurrences..
- Finally, the search field helps you to search for a specific term, which can include regular expressions.
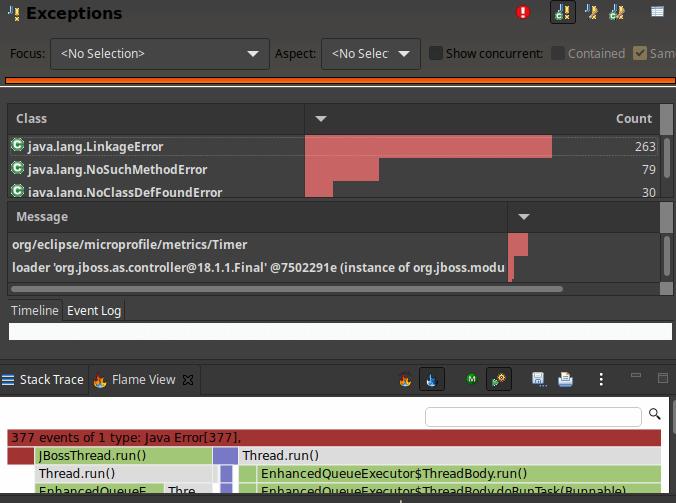
Then, if your applications throws a large number of Exceptions, switch to the Exceptions view. That will provide you the stats about the number of exceptions thrown during recording as well as their stack traces and details. Go through the “Overview” tab and check if you see:
- Any unexpected exceptions
- Unexpected number of expected exceptions
Conclusion
This article was a whirlwind tour over Java Flight Recorder and Java Mission Control application which allows to monitor and profile any kind of Java application from any angle. In the next article we will learn how to start Java Mission control from Eclipse.
Found the article helpful? if so please follow us on Socials


