The error “java.lang.OutOfMemoryError: GC overhead limit exceeded” is fairly common for old JDK (mostly JDK 1.6 and JDK 1.7) . Let’see how to solve it.
According to the JDK Troubleshooting guide, the “java.lang.OutOfMemoryError: GC overhead” limit exceeded indicates that the garbage collector is running all the time and Java program is making very slow progress. After a garbage collection, if the Java process is spending more than approximately 98% of its time doing garbage collection and if it is recovering less than 2% of the heap and has been doing so far the last 5 consecutive garbage collections, then a java.lang.OutOfMemoryErroris thrown. This exception is typically thrown because the amount of live data barely fits into the Java heap having little free space for new allocations.
This is meant to prevent applications from running for an extended period of time while making little or no progress reclaiming objects.
Before talking about the possible solution, it is worth to know that this feature can be disabled with the following option:
java -XX:-UseGCOverheadLimit
Disabling this throttle however, will just postpone the memory issue that will turn soon into a “java.lang.OutOfMemoryError: Java heap space.”
Possible solutions:
1) Check for Memory leaks with a memory profiling tool like Eclipse MAT ( https://www.eclipse.org/mat/), Visual VM etc and fix any memory leaks. To do that, include the following option in your JVM, so that an Heap dump will be created upon an Out of Memory error:
-XX:+HeapDumpOnOutOfMemoryError
Then, open the Heap Dump with Eclipse Mat and generate a Leak Suspect report as in this example:
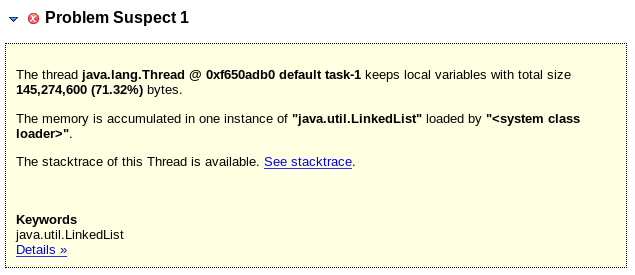
As you can see, MAT has found one leak suspect, which occupies 71% of application’s memory, taken by instances of class java.util.LinkedList. If you click on the “Details” link you will see some more info about where the instances reside and why they are so big. That should be also evident by clicking on the See Stracktrace link, which will print the stack trace of that Thread.
2) If you cannot find any memory leak, increase the heap size if current heap is not enough. for example:
java -Xmx6g
3) Also, if you don’t have memory leaks in your application, it is recommended to upgrade to a newer version of JDK which uses the G1GC algorithm. The throughput goal for the G1 GC is 90 percent application time and 10 percent garbage collection time. As a proof of concept, consider the following Class, which reproduces the OutOfMemoryError: GC overhead limit exceeded with JDK 1.6, using the Parallel GC:
class Main {
    public static void main(String args[]) throws Exception {
        Map map = System.getProperties();
        Random rnd = new Random();
        while (true) {
            map.put(rnd.nextInt(), "val");
            System.gc();
        }
    }
}
The same application code will not trigger the OutOfMemoryError: GC overhead limit exceeded when upgrading to JDK 1.8 and using the G1GC algorithm.
4) If the new generation size is explicitly defined with JVM options (e.g. -XX:NewSize, -XX:MaxNewSize), decrease the size or remove the relevant JVM options entirely to unconstrain the JVM and provide more space in the old generation for long lived objects.
5) Enable the standard garbage collection logging options and analyze the logging. For example:
java -verbose:gc -Xloggc:gc.log.`date +%Y%m%d%H%M%S` -XX:+PrintGCDetails -XX:+PrintGCTimeStamps -XX:+PrintGCApplicationStoppedTime
6) Check out as well promotion failures and frequent full GC sweeps that fail to free up a lot of memory:
java -XX:+PrintGCDetails -XX:+PrintPromotionFailure -XX:PrintFLSStatistics=1
Found the article helpful? if so please follow us on Socials


