This article will teach you how to use the OpenTelemetry API in a sample REST Service which uses WildFly Bootable jar technology as runtime.
An overview of OpenTelemetry
OpenTelemetry is a set of APIs and libraries that provide a vendor-neutral and open standard for observability in cloud-native applications. It allows developers to instrument their code and collect data about its performance and behavior, which can then be used to troubleshoot issues and improve the overall quality of the application.
The OpenTelemetry API is the core component of the OpenTelemetry ecosystem. It provides a consistent and uniform interface for interacting with different observability data sources, such as metrics, traces, and logs. This allows developers to easily integrate observability data into their applications, regardless of the underlying technology or platform.
Recommended readings:
- In the following article, you can learn how to use OpenTelemetry API with WildFly: Using Open Telemetry API in your Microservices
- Then, in this article, you will learn the basics of WildFly Bootable Jar technology: Turn your WildFly application in a Bootable JAR
Coding a sample Service
The following sample REST Endpoint shows how to send Spans through the injected Tracer Class:
@Path("/simple")
@ApplicationScoped
public class SimpleRESTService {

    @Inject
    private Tracer tracer;

    @GET
    @Path("/xml")
    @Produces(MediaType.APPLICATION_XML)
    public SimpleProperty getPropertyXML ()
    {
        final Span span = tracer.spanBuilder("Preparing XML").startSpan();
        span.makeCurrent();

        SimpleProperty p = new SimpleProperty(UUID.randomUUID().toString(),
                                                      UUID.randomUUID().toString());

        span.addEvent("Built Property");
        span.end();

        return p;
    }

    @GET
    @Path("/json")
    @Produces(MediaType.APPLICATION_JSON)
    public SimpleProperty getPropertyJSON (@Context HttpServletRequest request)
    {
        final Span span = tracer.spanBuilder("Preparing JSON").setAttribute("SESSION", request.getSession().getId())
                .startSpan();
        span.makeCurrent();

        SimpleProperty p = new SimpleProperty(UUID.randomUUID().toString(),
                UUID.randomUUID().toString());

        span.addEvent("Built Property");
        span.end();

        return p;
    }


}
Here is more about the above Class:
- Firstly, we are creating a Span from the Tracer object through its factory method
tracer.spanBuilder. - Then, we are optionally adding an Attribute to one of the Spans we are creating. For example, the method
getPropertyJSONshows how to add the SessionId attribute to the Span so that you can search traces globally for a specific HTTP Session. - A Span has also the ability to add Events which have a time associated with the moment when they are added to the Span. For example, you can use them to record the length of some tasks.
- Finally, we call the
endoperation to signal that the Span operation has now ended.
Building the application
In order to build the above application, you need to include the opentelemetry-api dependency in your project. Besides, we will also add the Jakarta EE dependency:
 <dependency>
	    <groupId>io.opentelemetry</groupId>
	    <artifactId>opentelemetry-api</artifactId>
	    <version>${opentelemetry.version}</version>
</dependency>

<dependency>
      <groupId>jakarta.platform</groupId>
      <artifactId>jakarta.jakartaee-api</artifactId>
      <version>${jakartaee.version}</version>
      <scope>provided</scope>
</dependency>
Then, we will configure WildFly Bootable Jar plugin as follows:
  <build>
    <finalName>${project.artifactId}</finalName>
    <plugins>
      <plugin>
        <groupId>org.wildfly.plugins</groupId>
        <artifactId>wildfly-jar-maven-plugin</artifactId>
        <configuration>
          <feature-pack-location>wildfly@maven(org.jboss.universe:community-universe)#${version.wildfly}</feature-pack-location>
          <layers>
            <layer>jaxrs-server</layer>
            <layer>opentelemetry</layer>
          </layers>
          <excluded-layers>
            <layer>deployment-scanner</layer>
          </excluded-layers>
          <plugin-options>
            <jboss-fork-embedded>${plugin.fork.embedded}</jboss-fork-embedded>
          </plugin-options>
        </configuration>
        <executions>
          <execution>
            <goals>
              <goal>package</goal>
            </goals>
          </execution>
        </executions>
      </plugin>
Please notice that we are using the opentelemetry layers to include in the Bootable Jar the opentelemetry extension and subsystem.
Testing the application
To test the above application, we need a tracing serer. For example, we can start a Jeager instance with Docker:
docker run --rm -d --name jaeger -p 6831:6831/udp -p 5778:5778 -p 14250:14250 -p 14268:14268 -p 16686:16686 jaegertracing/all-in-one:1.16
Finally, start the application with:
mvn install wildfly-jar:run
Then, launch some HTTP Requests to the endpoints:
curl http://localhost:8080/rest/simple/json

curl http://localhost:8080/rest/simple/xml
To check the application traces, connect to the Jaeger Console at this URL: http://localhost:16686
Select the “wildfly” application and check the Spans:
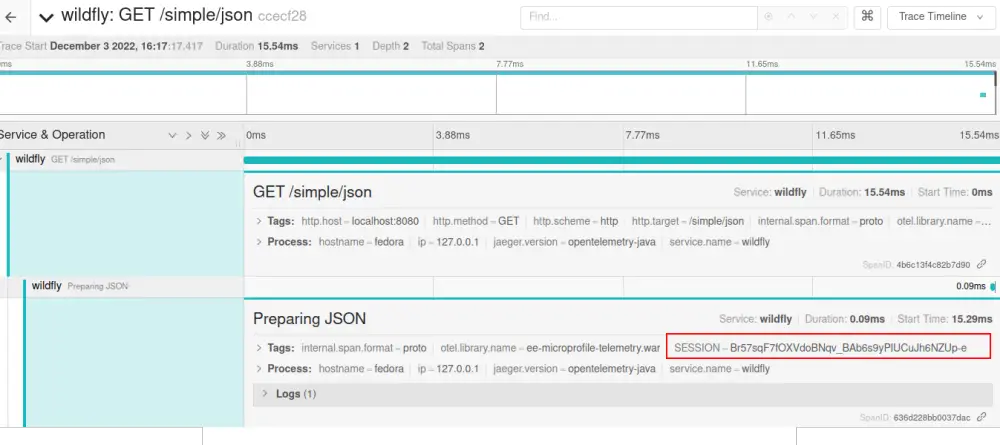
As you can see from the above picture, we have a Trace Timeline for our Spans. Within it, you can see the SESSION attribute as a Tag in the Span.
Conclusion
In conclusion, the OpenTelemetry API is a powerful and flexible tool for adding observability to cloud-native applications. Its support for distributed tracing, metrics, and logs, as well as its wide range of language and platform support, make it a valuable addition to any developer’s toolkit.
Source code: https://github.com/fmarchioni/practical-enterprise-development/tree/bootable-jakartaee/code/microprofile/telemetry
The source code is an excerpt from the book Practical Enterprise Application Development (Jakarta EE 10 version) that will be launched next week. Stay tuned!
Many thanks to our Red Hat engineer Jean-Francois Denise for helping me in coding the configuration for the Bootable Jar plugin.
Found the article helpful? if so please follow us on Socials


